
Prometheus 第37章:HTTP API
2026/8/13大约 14 分钟
Prometheus · 第 37 章(合并)
由原课程小节笔记合并,便于连续阅读。
37.1 prometheus管理接口源码讲解
本节重点介绍 :
- 生命周期控制相关
- reload 热更新配置
- pprof相关
- prometheus pprof 查看火焰图
- 存储操作相关
生命周期控制相关
- 代码位置位置 D:\go_path\src\github.com\prometheus\prometheus\web\web.go
	if o.EnableLifecycle {
		router.Post("/-/quit", h.quit)
		router.Put("/-/quit", h.quit)
		router.Post("/-/reload", h.reload)
		router.Put("/-/reload", h.reload)
	} else {
		forbiddenAPINotEnabled := func(w http.ResponseWriter, _ *http.Request) {
			w.WriteHeader(http.StatusForbidden)
			w.Write([]byte("Lifecycle API is not enabled."))
		}
		router.Post("/-/quit", forbiddenAPINotEnabled)
		router.Put("/-/quit", forbiddenAPINotEnabled)
		router.Post("/-/reload", forbiddenAPINotEnabled)
		router.Put("/-/reload", forbiddenAPINotEnabled)
}- reload的源码在3.7已经讲解过了
- quit代表退出
- 如果 --web.enable-lifecycle没开启的话访问会报错
Lifecycle API is not enabled.pprof相关
- 代码位置 D:\go_path\src\github.com\prometheus\prometheus\web\web.go
func serveDebug(w http.ResponseWriter, req *http.Request) {
	ctx := req.Context()
	subpath := route.Param(ctx, "subpath")

	if subpath == "/pprof" {
		http.Redirect(w, req, req.URL.Path+"/", http.StatusMovedPermanently)
		return
	}

	if !strings.HasPrefix(subpath, "/pprof/") {
		http.NotFound(w, req)
		return
	}
	subpath = strings.TrimPrefix(subpath, "/pprof/")

	switch subpath {
	case "cmdline":
		pprof.Cmdline(w, req)
	case "profile":
		pprof.Profile(w, req)
	case "symbol":
		pprof.Symbol(w, req)
	case "trace":
		pprof.Trace(w, req)
	default:
		req.URL.Path = "/debug/pprof/" + subpath
		pprof.Index(w, req)
	}
}
pprof实例
- 访问地址 /debug/pprof/
Types of profiles available:
Count	Profile
2255	allocs
0	block
0	cmdline
66	goroutine
2255	heap
0	mutex
0	profile
16	threadcreate
0	trace
full goroutine stack dump
Profile Descriptions:

allocs: A sampling of all past memory allocations
block: Stack traces that led to blocking on synchronization primitives
cmdline: The command line invocation of the current program
goroutine: Stack traces of all current goroutines
heap: A sampling of memory allocations of live objects. You can specify the gc GET parameter to run GC before taking the heap sample.
mutex: Stack traces of holders of contended mutexes
profile: CPU profile. You can specify the duration in the seconds GET parameter. After you get the profile file, use the go tool pprof command to investigate the profile.
threadcreate: Stack traces that led to the creation of new OS threads
trace: A trace of execution of the current program. You can specify the duration in the seconds GET parameter. After you get the trace file, use the go tool trace command to investigate the trace.
pprof作用
- pprof 是 Go 语言中分析程序运行性能的工具,它能提供各种性能数据:
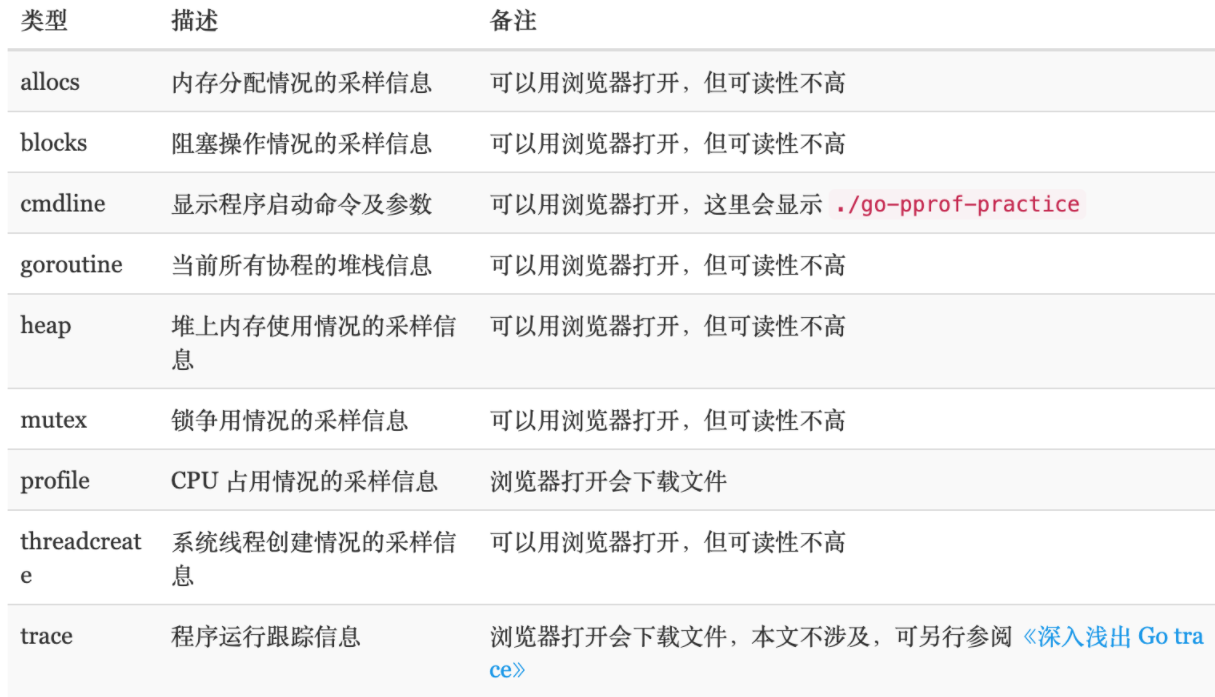
主要体现下面4种实用功能
- CPU Profiling:CPU 分析,按照一定的频率采集所监听的应用程序 CPU(含寄存器)的使用情况,可确定应用程序在主动消耗 CPU 周期时花费时间的位置
- Memory Profiling:内存分析,在应用程序进行堆分配时记录堆栈跟踪,用于监视当前和历史内存使用情况,以及检查内存泄漏
- Block Profiling:阻塞分析,记录 goroutine 阻塞等待同步(包括定时器通道)的位置
- Mutex Profiling:互斥锁分析,报告互斥锁的竞争情况
prometheus pprof 查看火焰图
安装作图库
- yum -y install graphviz
直接生成svg文件
go tool pprof -svg http://localhost:9090/debug/pprof/heap > b.svghttp直接查看
go tool pprof --http=0.0.0.0:7777 http://localhost:9090/debug/pprof/heap
Fetching profile over HTTP from http://localhost:10000/debug/pprof/profile?seconds=30
Saved profile in /root/pprof/pprof.a.samples.cpu.002.pb.gz
Serving web UI on http://0.0.0.0:7777
http://0.0.0.0:7777
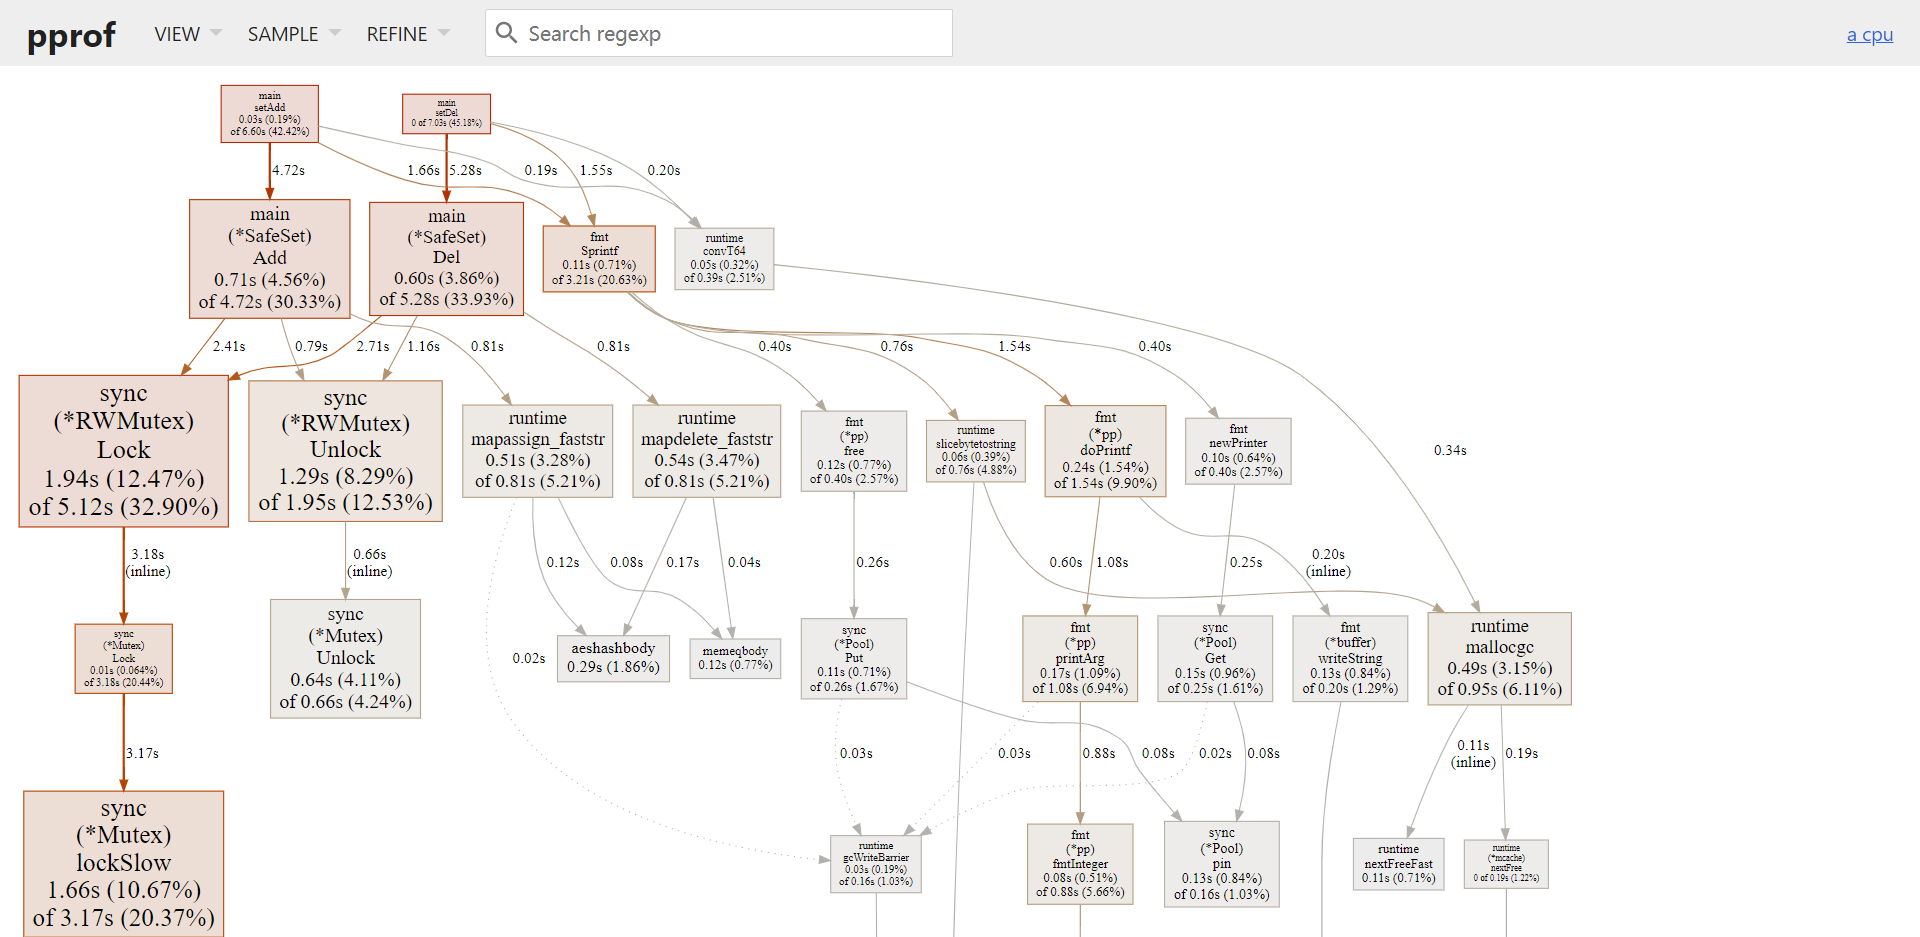
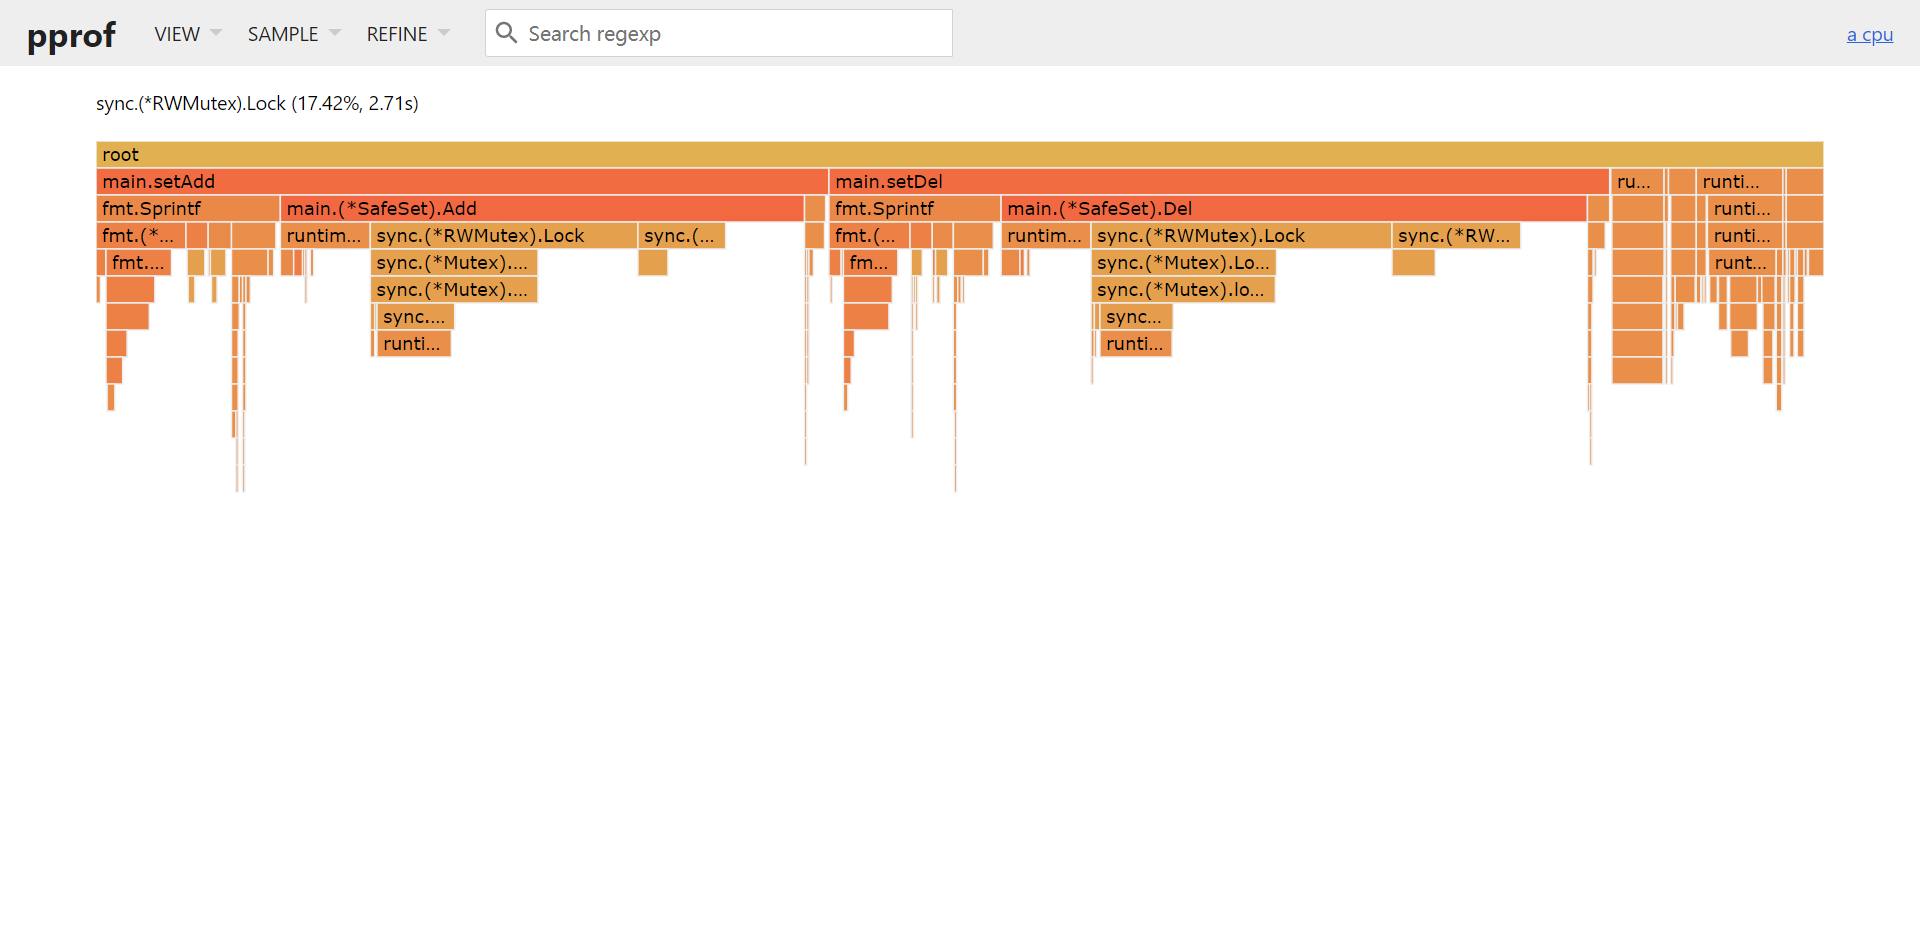
火焰图样例

存储操作相关
- 代码位置 D:\go_path\src\github.com\prometheus\prometheus\web\api\v1\api.go
	// Admin APIs
	r.Post("/admin/tsdb/delete_series", wrap(api.deleteSeries))
	r.Post("/admin/tsdb/clean_tombstones", wrap(api.cleanTombstones))
	r.Post("/admin/tsdb/snapshot", wrap(api.snapshot))

	r.Put("/admin/tsdb/delete_series", wrap(api.deleteSeries))
	r.Put("/admin/tsdb/clean_tombstones", wrap(api.cleanTombstones))
r.Put("/admin/tsdb/snapshot", wrap(api.snapshot))- 这些操作需要 web.enable-admin-api=true
	a.Flag("web.enable-admin-api", "Enable API endpoints for admin control actions.").
		Default("false").BoolVar(&cfg.web.EnableAdminAPI)
删除series(不常用)
- 调用api.db.Delete删除数据
- 数据的删除不应该手动触发,应该让tsdb 做过期删除
func (api *API) deleteSeries(r *http.Request) apiFuncResult {
	if !api.enableAdmin {
		return apiFuncResult{nil, &apiError{errorUnavailable, errors.New("admin APIs disabled")}, nil, nil}
	}
	if err := r.ParseForm(); err != nil {
		return apiFuncResult{nil, &apiError{errorBadData, errors.Wrap(err, "error parsing form values")}, nil, nil}
	}
	if len(r.Form["match[]"]) == 0 {
		return apiFuncResult{nil, &apiError{errorBadData, errors.New("no match[] parameter provided")}, nil, nil}
	}

	start, err := parseTimeParam(r, "start", minTime)
	if err != nil {
		return invalidParamError(err, "start")
	}
	end, err := parseTimeParam(r, "end", maxTime)
	if err != nil {
		return invalidParamError(err, "end")
	}

	for _, s := range r.Form["match[]"] {
		matchers, err := parser.ParseMetricSelector(s)
		if err != nil {
			return invalidParamError(err, "match[]")
		}
		if err := api.db.Delete(timestamp.FromTime(start), timestamp.FromTime(end), matchers...); err != nil {
			return apiFuncResult{nil, &apiError{errorInternal, err}, nil, nil}
		}
	}

	return apiFuncResult{nil, nil, nil, nil}
}
本节重点总结 :
- 生命周期控制相关
- reload 热更新配置
- pprof相关
- prometheus pprof 查看火焰图
- 存储操作相关
37.2 prometheus分析接口源码讲解
本节重点介绍 :
- 获取配置文件 config
- 获取运行信息 runtimeinfo
- 编译的信息 buildinfo
- tsdb统计信息 tsdb
- walreplay的信息
- target统计信息
- 获取metrics的元信息
状态信息相关
获取配置文件
- path /api/v1/status/config
- 代码位置 D:\go_path\src\github.com\prometheus\prometheus\web\api\v1\api.go
func (api *API) serveConfig(_ *http.Request) apiFuncResult {
	cfg := &prometheusConfig{
		YAML: api.config().String(),
	}
	return apiFuncResult{cfg, nil, nil, nil}
}- 通过yaml.Marshal获取配置
获取运行信息
- path /api/v1/status/runtimeinfo
func (api *API) serveRuntimeInfo(_ *http.Request) apiFuncResult {
	status, err := api.runtimeInfo()
	if err != nil {
		return apiFuncResult{status, &apiError{errorInternal, err}, nil, nil}
	}
	return apiFuncResult{status, nil, nil, nil}
}
底层信息函数
- 位置 D:\go_path\src\github.com\prometheus\prometheus\web\web.go
func (h *Handler) runtimeInfo() (api_v1.RuntimeInfo, error) {
	status := api_v1.RuntimeInfo{
		StartTime:      h.birth,
		CWD:            h.cwd,
		GoroutineCount: runtime.NumGoroutine(),
		GOMAXPROCS:     runtime.GOMAXPROCS(0),
		GOGC:           os.Getenv("GOGC"),
		GODEBUG:        os.Getenv("GODEBUG"),
	}

	if h.options.TSDBRetentionDuration != 0 {
		status.StorageRetention = h.options.TSDBRetentionDuration.String()
	}
	if h.options.TSDBMaxBytes != 0 {
		if status.StorageRetention != "" {
			status.StorageRetention = status.StorageRetention + " or "
		}
		status.StorageRetention = status.StorageRetention + h.options.TSDBMaxBytes.String()
	}

	metrics, err := h.gatherer.Gather()
	if err != nil {
		return status, errors.Errorf("error gathering runtime status: %s", err)
	}
	for _, mF := range metrics {
		switch *mF.Name {
		case "prometheus_tsdb_wal_corruptions_total":
			status.CorruptionCount = int64(toFloat64(mF))
		case "prometheus_config_last_reload_successful":
			status.ReloadConfigSuccess = toFloat64(mF) != 0
		case "prometheus_config_last_reload_success_timestamp_seconds":
			status.LastConfigTime = time.Unix(int64(toFloat64(mF)), 0).UTC()
		}
	}
	return status, nil
}- 字段解读
- StartTime 启动时间
- CWD 运行位置
- GoroutineCount 代表goroutine数量
- GOMAXPROCS 代表p数量
- lastConfigTime 上次加载配置文件的时间
- ReloadConfigSuccess 上次加载配置文件是否成功
编译的信息
- path /api/v1/status/buildinfo
- 字段解读
- version 版本信息
- revision commit号
- branch 分支
- buildUser 编译的user
- buildDate 编译的时间
- goVersion go版本
命令行参数
- path /api/v1/status/flags
- 代码 D:\go_path\src\github.com\prometheus\prometheus\cmd\prometheus\main.go
- 来自命令行的解析结果
	cfg.web.Flags = map[string]string{}

	// Exclude kingpin default flags to expose only Prometheus ones.
	boilerplateFlags := kingpin.New("", "").Version("")
	for _, f := range a.Model().Flags {
		if boilerplateFlags.GetFlag(f.Name) != nil {
			continue
		}

		cfg.web.Flags[f.Name] = f.Value.String()
	}
tsdb统计信息
- path /api/v1/status/tsdb
- 源码在 32.2和倒排索引一起讲了
walreplay的信息
- /api/v1/status/walreplay
func (api *API) serveWALReplayStatus(w http.ResponseWriter, r *http.Request) {
	httputil.SetCORS(w, api.CORSOrigin, r)
	status, err := api.db.WALReplayStatus()
	if err != nil {
		api.respondError(w, &apiError{errorInternal, err}, nil)
	}
	api.respond(w, walReplayStatus{
		Min:     status.Min,
		Max:     status.Max,
		Current: status.Current,
	}, nil)
}
target统计信息
- path /api/v1/targets
- target源码在 24.2讲解过了
获取metrics的元信息
- path /api/v1/metadata
- 底层来自于 Target.metadata字段,位置 D:\go_path\src\github.com\prometheus\prometheus\scrape\target.go
type Target struct {
	// Labels before any processing.
	discoveredLabels labels.Labels
	// Any labels that are added to this target and its metrics.
	labels labels.Labels
	// Additional URL parameters that are part of the target URL.
	params url.Values

	mtx                sync.RWMutex
	lastError          error
	lastScrape         time.Time
	lastScrapeDuration time.Duration
	health             TargetHealth
	metadata           MetricMetadataStore
}
本节重点总结 :
- 获取配置文件 config
- 获取运行信息 runtimeinfo
- 编译的信息 buildinfo
- tsdb统计信息 tsdb
- walreplay的信息
- target统计信息
- 获取metrics的元信息
37.3 prometheus5大数据查询接口
本节重点介绍 :
- 5大数据查询接口
- instant_query查询一个点
- range_query查询一段时间数据
- series查询 全量标签数据
- labels查询 标签key集合
- label values查询
5大数据查询接口
instant_query查询
- 对应uri为
/api/v1/query - 报警使⽤、预聚合、当前点查询(table)
- 可以用来调用监控数据生成报表
python脚本
import json
import time

import requests
import logging

logging.basicConfig(
    format='%(asctime)s %(levelname)s %(filename)s [func:%(funcName)s] [line:%(lineno)d]:%(message)s',
    datefmt="%Y-%m-%d %H:%M:%S",
    level="INFO"
)

def ins_query(host,expr="node_disk_reads_merged_total"):
    start_ts = time.perf_counter()
    uri="http://{}/api/v1/query".format(host)
    g_parms = {
        "query": expr,
    }
    res = requests.get(uri, g_parms)

    if res.status_code!=200:
        msg = "[error_code_not_200]"
        logging.error(msg)
        return
    jd = res.json()
    if not jd:
        msg = "[error_loads_json]"
        logging.error(msg)
        return
    inner_d = jd.get("data")
    if not inner_d:
        return

    result = inner_d.get("result")
    result_series = len(result)
    end_ts = time.perf_counter()
    for index,x in enumerate(result):
        msg = "[series:{}/{}][metric:{}]".format(
            index+1,
            result_series,
            json.dumps(x.get("metric"),indent=4)
        )
        logging.info(msg)
    msg = "Load time: {}  Resolution: {}s   Result series: {}".format(
        end_ts-start_ts,
        15,
        result_series
    )
    logging.info(msg)
if __name__ == '__main__':
    ins_query("192.168.0.106:9090",expr='''max(rate(node_network_receive_bytes_total{origin_prometheus=~"",job=~"node_exporter"}[2m])*8) by (instance)''')
源码
- 首先解析时间,意思是可以查询之前的一个时间戳的数据,默认我们不指定,由前端拿当前时间做为参数
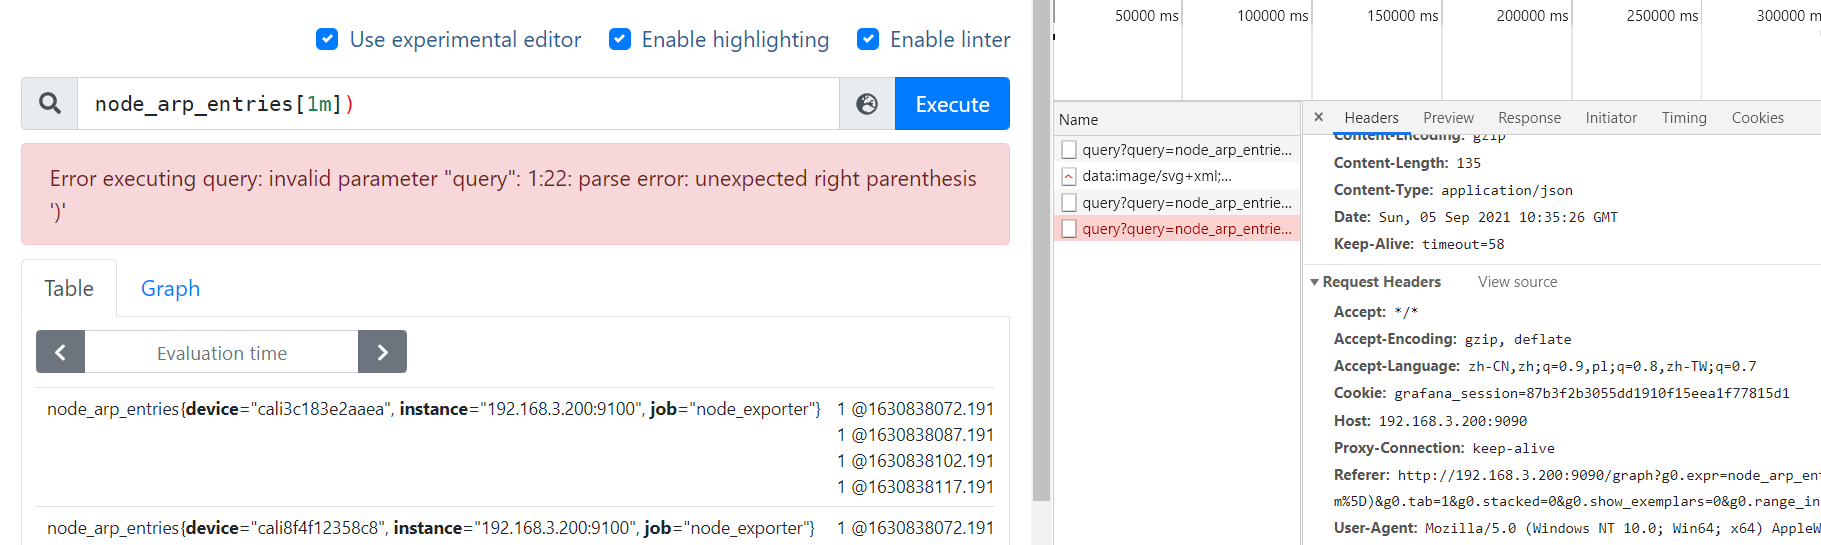
- 用 传入的ql参数初始化 NewInstantQuery,同时判断错误
- 主要是判断用户传入的ql是否正确
- api.Queryable是merge的stroage ,本地或者还有remote的
	qry, err := api.QueryEngine.NewInstantQuery(api.Queryable, r.FormValue("query"), ts)
	if err == promql.ErrValidationAtModifierDisabled {
		err = errors.New("@ modifier is disabled, use --enable-feature=promql-at-modifier to enable it")
	} else if err == promql.ErrValidationNegativeOffsetDisabled {
		err = errors.New("negative offset is disabled, use --enable-feature=promql-negative-offset to enable it")
	}
	if err != nil {
		return invalidParamError(err, "query")
	}
- 调用exec执行查询
	res := qry.Exec(ctx)
	if res.Err != nil {
		return apiFuncResult{nil, returnAPIError(res.Err), res.Warnings, qry.Close}
	}

	// Optional stats field in response if parameter "stats" is not empty.
	var qs *stats.QueryStats
	if r.FormValue("stats") != "" {
		qs = stats.NewQueryStats(qry.Stats())
	}

	return apiFuncResult{&queryData{
		ResultType: res.Value.Type(),
		Result:     res.Value,
		Stats:      qs,
	}, nil, res.Warnings, qry.Close}
range_query查询
- 对应uri为
/api/v1/query_range - 查询⼀段时间的曲线
- 可以用来调用监控数据生成报表
- 模拟prometheus页面打印的结果

2021-05-03 09:06:55 INFO 001_range_query.py [func:ins_query] [line:51]:[series:1/2][metric:{
    "__name__": "node_load1",
    "instance": "192.168.43.114:9100",
    "job": "node_exporter"
}]
2021-05-03 09:06:55 INFO 001_range_query.py [func:ins_query] [line:51]:[series:2/2][metric:{
    "__name__": "node_load1",
    "instance": "192.168.43.2:9100",
    "job": "node_exporter"
}]
2021-05-03 09:06:55 INFO 001_range_query.py [func:ins_query] [line:57]:Load time: 0.006407099999999999  Resolution: 30s   Result series: 2
源码解读
queryRange 位置 F:\go_path\src\github.com\prometheus\prometheus\web\api\v1\api.go
首先解析时间参数
- 解析start 和end时间,start必须要在end前面
- 解析分辨率参数,要求 时间差/分辨率 不能大于11000,目的是防止返回的点数过多
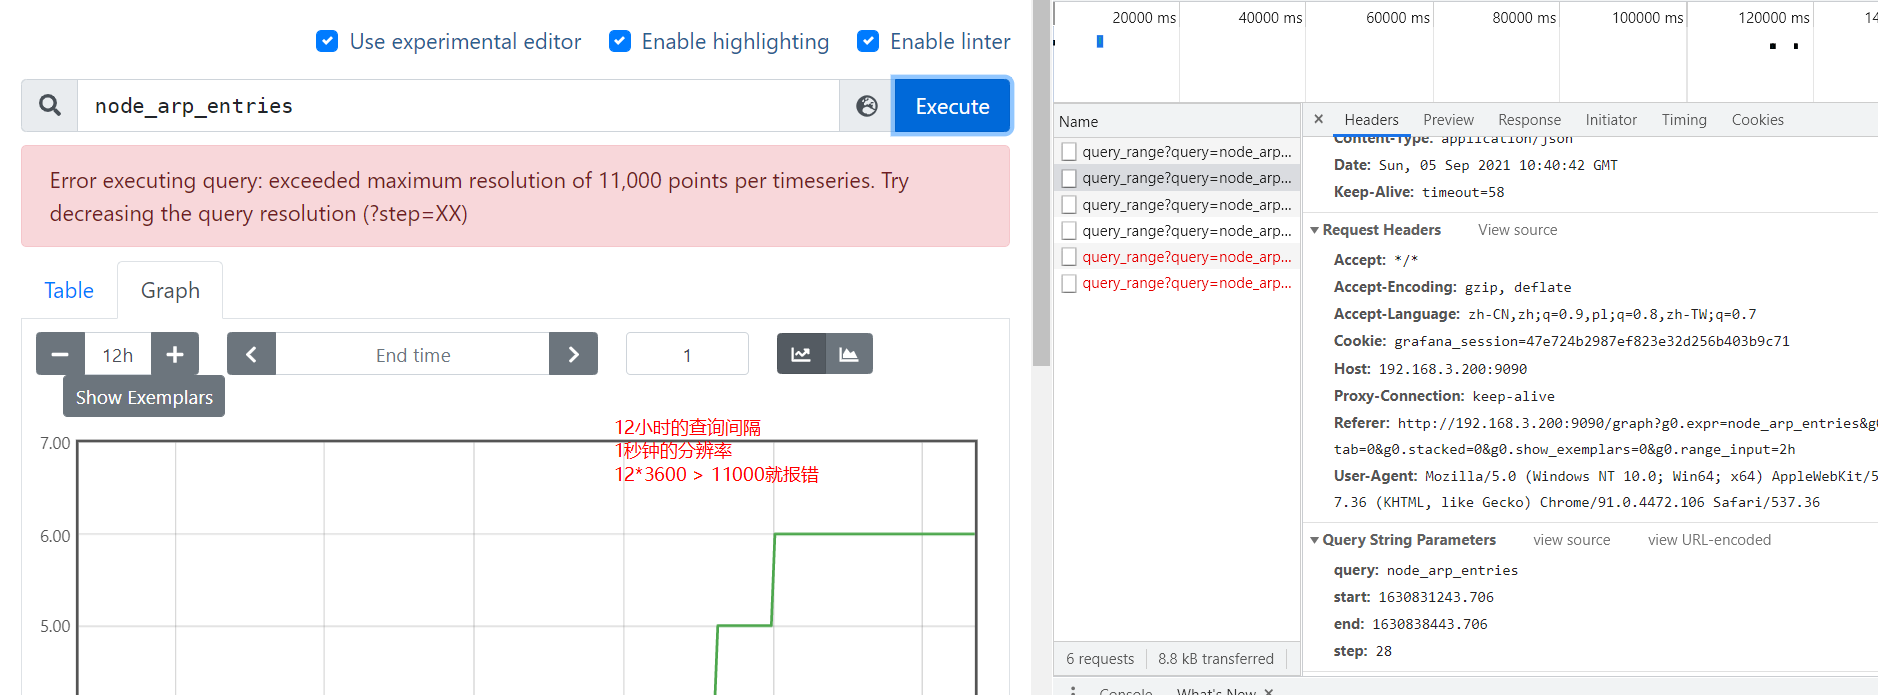
 start, err := parseTime(r.FormValue("start"))
 if err != nil {
 	return invalidParamError(err, "start")
 }
 end, err := parseTime(r.FormValue("end"))
 if err != nil {
 	return invalidParamError(err, "end")
 }
 if end.Before(start) {
 	return invalidParamError(errors.New("end timestamp must not be before start time"), "end")
 }

 step, err := parseDuration(r.FormValue("step"))
 if err != nil {
 	return invalidParamError(err, "step")
 }

 if step <= 0 {
 	return invalidParamError(errors.New("zero or negative query resolution step widths are not accepted. Try a positive integer"), "step")
 }

 // For safety, limit the number of returned points per timeseries.
 // This is sufficient for 60s resolution for a week or 1h resolution for a year.
 if end.Sub(start)/step > 11000 {
 	err := errors.New("exceeded maximum resolution of 11,000 points per timeseries. Try decreasing the query resolution (?step=XX)")
 	return apiFuncResult{nil, &apiError{errorBadData, err}, nil, nil}
 }
用存储new一个rangeQuery的对象,也需要校验用户传入ql是否正确
	qry, err := api.QueryEngine.NewRangeQuery(api.Queryable, r.FormValue("query"), start, end, step)
	if err == promql.ErrValidationAtModifierDisabled {
		err = errors.New("@ modifier is disabled, use --enable-feature=promql-at-modifier to enable it")
	} else if err == promql.ErrValidationNegativeOffsetDisabled {
		err = errors.New("negative offset is disabled, use --enable-feature=promql-negative-offset to enable it")
	}
	if err != nil {
		return apiFuncResult{nil, &apiError{errorBadData, err}, nil, nil}
	}
调用exec查询结果
	res := qry.Exec(ctx)
	if res.Err != nil {
		return apiFuncResult{nil, returnAPIError(res.Err), res.Warnings, qry.Close}
	}

	// Optional stats field in response if parameter "stats" is not empty.
	var qs *stats.QueryStats
	if r.FormValue("stats") != "" {
		qs = stats.NewQueryStats(qry.Stats())
	}

	return apiFuncResult{&queryData{
		ResultType: res.Value.Type(),
		Result:     res.Value,
		Stats:      qs,
	}, nil, res.Warnings, qry.Close}
python脚本
import json
import time
import requests
import logging

logging.basicConfig(
    format='%(asctime)s %(levelname)s %(filename)s [func:%(funcName)s] [line:%(lineno)d]:%(message)s',
    datefmt="%Y-%m-%d %H:%M:%S",
    level="INFO"
)

def ins_query(host,expr="node_load1"):
    start_ts = time.perf_counter()
    uri="http://{}/api/v1/query_range".format(host)
    end = int(time.time())
    minutes = 5 * 12
    start = end - minutes * 60

    # step = 20 * (1 + minutes // 60)
    step = 30
    G_PARMS = {
        "query": expr,
        "start": start,
        "end": end,
        "step": step
    }
    res = requests.get(uri, G_PARMS)

    if res.status_code!=200:
        msg = "[error_code_not_200]"
        logging.error(msg)
        return
    jd = res.json()
    if not jd:
        msg = "[error_loads_json]"
        logging.error(msg)
        return
    inner_d = jd.get("data")
    if not inner_d:
        return
    result = inner_d.get("result")
    result_series = len(result)
    end_ts = time.perf_counter()
    for index,x in enumerate(result):
        msg = "[series:{}/{}][metric:{}]".format(
            index+1,
            result_series,
            json.dumps(x.get("metric"),indent=4)
        )
        logging.info(msg)
    msg = "Load time: {}  Resolution: {}s   Result series: {}".format(
        end_ts-start_ts,
        step,
        result_series
    )
    logging.info(msg)
if __name__ == '__main__':
    ins_query("192.168.43.114:9090")
series查询
- 对应uri为
/api/v1/series - grafana 使⽤label_values查询变量
- grafana label_values 根据
node_uname_info{job="node_exporter"}查询instance变量的集合
label_values(node_uname_info{job="node_exporter"}, instance)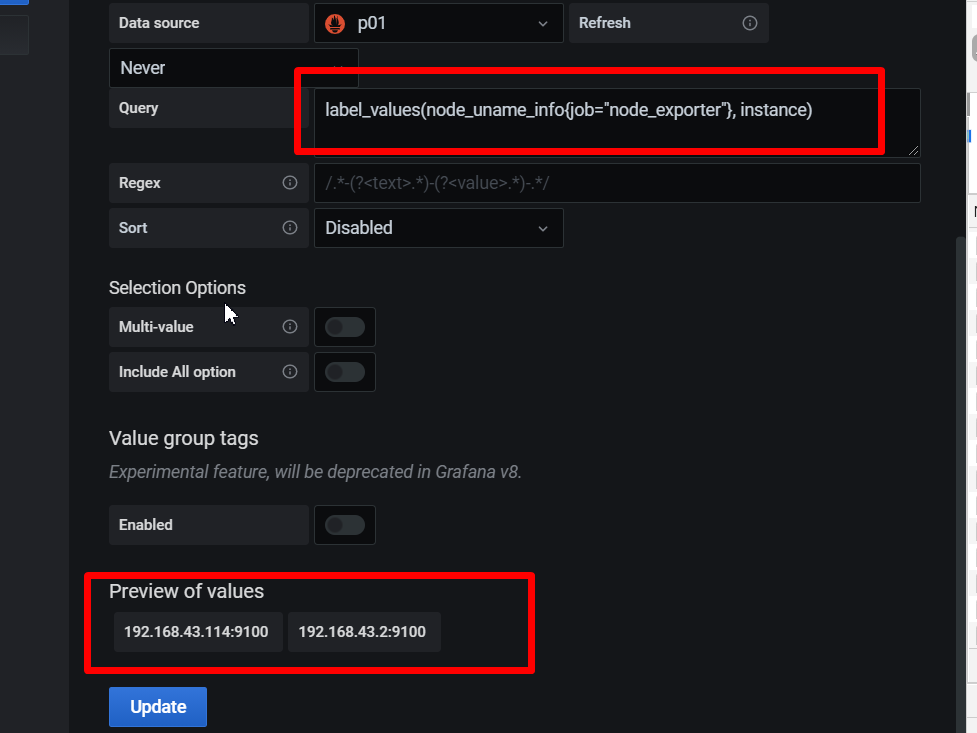
源码解读series
- 解析查询参数,一定要求有match,不然报错
if err := r.ParseForm(); err != nil { return apiFuncResult{nil, &apiError{errorBadData, errors.Wrapf(err, "error parsing form values")}, nil, nil} } if len(r.Form["match[]"]) == 0 { return apiFuncResult{nil, &apiError{errorBadData, errors.New("no match[] parameter provided")}, nil, nil} } start, err := parseTimeParam(r, "start", minTime) if err != nil { return invalidParamError(err, "start") } end, err := parseTimeParam(r, "end", maxTime) if err != nil { return invalidParamError(err, "end") } matcherSets, err := parseMatchersParam(r.Form["match[]"]) if err != nil { return invalidParamError(err, "match[]") }- 使用query存储创建querier对象
q, err := api.Queryable.Querier(r.Context(), timestamp.FromTime(start), timestamp.FromTime(end)) if err != nil { return apiFuncResult{nil, &apiError{errorExec, err}, nil, nil} }- 构造select查询,并执行
hints := &storage.SelectHints{ Start: timestamp.FromTime(start), End: timestamp.FromTime(end), Func: "series", // There is no series function, this token is used for lookups that don't need samples. } var sets []storage.SeriesSet for _, mset := range matcherSets { // We need to sort this select results to merge (deduplicate) the series sets later. s := q.Select(true, hints, mset...) sets = append(sets, s) }- 最后对结果进行merge
	var sets []storage.SeriesSet
	for _, mset := range matcherSets {
		// We need to sort this select results to merge (deduplicate) the series sets later.
		s := q.Select(true, hints, mset...)
		sets = append(sets, s)
	}

	set := storage.NewMergeSeriesSet(sets, storage.ChainedSeriesMerge)
	metrics := []labels.Labels{}
	for set.Next() {
		metrics = append(metrics, set.At().Labels())
	}
python脚本
import json
import time
import requests
import logging
import curlify

logging.basicConfig(
    format='%(asctime)s %(levelname)s %(filename)s [func:%(funcName)s] [line:%(lineno)d]:%(message)s',
    datefmt="%Y-%m-%d %H:%M:%S",
    level="INFO"
)

def label_values(host, metric_name, exist_tag_kv, tag_key):

    uri = 'http://{}/api/v1/series'.format(host)
    end = int(time.time())
    start = end - 5 * 60
    expr= '''%s{%s}''' % (metric_name, exist_tag_kv),
    G_PARMS = {
        "match[]": expr,
        "start": start,
        "end": end,
    }
    res = requests.get(uri, G_PARMS,timeout=5)
    print(curlify.to_curl(res.request))
    tag_values = set()
    if res.status_code != 200:
        msg = "[error_code_not_200]"
        logging.error(msg)
        return
    jd = res.json()
    if not jd:
        msg = "[error_loads_json]"
        logging.error(msg)
        return
    for i in jd.get("data"):
        tag_values.add(i.get(tag_key))
    msg = "\n[prometheus_host:{}]\n[expr:{}]\n[target_tag:{}]\n[num:{}][tag_values:{}]".format(
        host,
        expr,
        tag_key,
        len(tag_values),
        tag_values)
    logging.info(msg)
    return tag_values

if __name__ == '__main__':
    start = time.perf_counter()
    label_values("172.20.70.205:9090","jvm_info",'job="jmx_exporter"',"instance")
    end  = time.perf_counter()
    haoshi = end-start
print(haoshi)- 对于python脚本调用结果为
2021-05-03 09:23:44 INFO 001_series_query.py [func:label_values] [line:43]:
[prometheus_host:192.168.43.114:9090]
[expr:('node_uname_info{job="node_exporter"}',)]
[target_tag:instance]
[num:2][tag_values:{'192.168.43.2:9100', '192.168.43.114:9100'}]- 再排序即可
- 注意这里是重查询的可能点之一?思考为什么?开销在哪里
labels查询 标签key集合
- 对应uri为
/api/v1/labels - 获取标签key集合
源码解读 labelNames
- 如果配置了match就走labelnames的查询,同时要将series的结果过滤 标签的name
if len(matcherSets) > 0 { labelNamesSet := make(map[string]struct{}) for _, matchers := range matcherSets { vals, callWarnings, err := q.LabelNames(matchers...) if err != nil { return apiFuncResult{nil, &apiError{errorExec, err}, warnings, nil} } warnings = append(warnings, callWarnings...) for _, val := range vals { labelNamesSet[val] = struct{}{} } } // Convert the map to an array. names = make([]string, 0, len(labelNamesSet)) for key := range labelNamesSet { names = append(names, key) } sort.Strings(names) }- 如果没有matcher,那么直接查询labelsNames
else {
		names, warnings, err = q.LabelNames()
		if err != nil {
			return apiFuncResult{nil, &apiError{errorExec, err}, warnings, nil}
		}
	}
python脚本
import json
import time
import requests
import logging

logging.basicConfig(
    format='%(asctime)s %(levelname)s %(filename)s [func:%(funcName)s] [line:%(lineno)d]:%(message)s',
    datefmt="%Y-%m-%d %H:%M:%S",
    level="INFO"
)

def label_names(host, expr=""):

    uri = 'http://{}/api/v1/labels'.format(host)
    end = int(time.time())
    start = end - 5 * 60

    G_PARMS = {
        # "match[]": expr,
        "start": start,
        "end": end,
    }
    if expr:
        G_PARMS["match[]"] = expr
    res = requests.get(uri, G_PARMS)
    tag_values = set()
    if res.status_code != 200:
        msg = "[error_code_not_200]"
        logging.error(msg)
        return
    jd = res.json()
    if not jd:
        msg = "[error_loads_json]"
        logging.error(msg)
        return
    label_names_num = len(jd.get("data"))
    msg = "[series_selector:{}][label_names_num:{}][they are:{}]".format(
        expr,
        label_names_num,
        json.dumps(jd.get("data"),indent=4)
    )
    logging.info(msg)

if __name__ == '__main__':
    # label_names("192.168.43.114:9090","node_uname_info")
label_names("192.168.0.106:9090","node_cpu_seconds_total")- 举例1 获取node_uname_info的标签key集合
2021-05-03 09:43:26 INFO 001_labels_name_query.py [func:label_names] [line:40]:[series_selector:node_uname_info][label_names_num:9][they are:[
    "__name__",
    "domainname",
    "instance",
    "job",
    "machine",
    "nodename",
    "release",
    "sysname",
    "version"
]]- 举例2 获取一个prometheus的所有标签key集合
2021-05-03 09:45:32 INFO 001_labels_name_query.py [func:label_names] [line:43]:[series_selector:][label_names_num:83][they are:[
    "__name__",
    "account",
    "address",
    "alertmanager",
    "alertname",
    "alertstate",
    "branch",
"broadcast",- 原理
D:\nyy_work\go_path\pkg\mod\github.com\prometheus\prometheus@v1.8.2-0.20210220213500-8c8de46003d1\web\api\v1\api.go- 如果没有series_selector则获取指定block的标签集合
- 这个在head block中直接在倒排索引中返回,速度最快
- 如果有series_selector则需要遍历获取结果
label values查询
- 对应uri为
/api/v1/label/<label_name>/values - 获取标签label_name的 value集合
源码解读 labelValues
- 底层调用的就是head的倒排索引查询数据,位置 F:\go_path\src\github.com\prometheus\prometheus\tsdb\head_read.go
func (h *headIndexReader) LabelValues(name string, matchers ...*labels.Matcher) ([]string, error) {
	if h.maxt < h.head.MinTime() || h.mint > h.head.MaxTime() {
		return []string{}, nil
	}

	if len(matchers) == 0 {
		h.head.symMtx.RLock()
		defer h.head.symMtx.RUnlock()
		return h.head.postings.LabelValues(name), nil
	}

	return labelValuesWithMatchers(h, name, matchers...)
}
func (p *MemPostings) LabelValues(name string) []string {
	p.mtx.RLock()
	defer p.mtx.RUnlock()

	values := make([]string, 0, len(p.m[name]))
	for v := range p.m[name] {
		values = append(values, v)
	}
	return values
}
python脚本
import json
import time
import requests
import logging
import curlify

logging.basicConfig(
    format='%(asctime)s %(levelname)s %(filename)s [func:%(funcName)s] [line:%(lineno)d]:%(message)s',
    datefmt="%Y-%m-%d %H:%M:%S",
    level="INFO"
)

def label_values(host, label_name,expr="",):

    uri = 'http://{}/api/v1/label/{}/values'.format(host,label_name)
    end = int(time.time())
    start = end - 5 * 60

    G_PARMS = {
        # "match[]": expr,
        "start": start,
        "end": end,
    }
    if expr:
        G_PARMS["match[]"] = expr
    res = requests.get(uri, G_PARMS)
    print(curlify.to_curl(res.request))
    tag_values = set()
    if res.status_code != 200:
        msg = "[error_code_not_200]"
        logging.error(msg)
        return
    jd = res.json()
    if not jd:
        msg = "[error_loads_json]"
        logging.error(msg)
        return
    label_names_num = len(jd.get("data"))
    msg = "\n[series_selector:{}][target_label:{}][label_names_num:{}][they are:{}]".format(
        expr,
        label_name,
        label_names_num,
        json.dumps(jd.get("data"),indent=4)
    )
    logging.info(msg)

if __name__ == '__main__':
    # label_values("192.168.43.114:9090","job","")
label_values("192.168.0.106:9090","instance",'''node_arp_entries{job=~".*"}''')- 举例1 获取所有job的name集合
2021-05-03 09:54:28 INFO 001_labels_value_query.py [func:label_values] [line:44]:
[series_selector:][target_label:job][label_names_num:10][they are:[
    "blackbox-http",
    "blackbox-ping",
    "blackbox-ssh",
    "mysqld_exporter",
    "node_exporter",
    "process-exporter",
    "prometheus",
    "pushgateway",
    "redis_exporter_targets",
    "shard_job"
]]- 举例2:根据
node_uname_info{job="node_exporter"}查询instance变量的集合
2021-05-03 09:56:11 INFO 001_labels_value_query.py [func:label_values] [line:44]:
[series_selector:node_uname_info][target_label:instance][label_names_num:2][they are:[
    "192.168.43.114:9100",
    "192.168.43.2:9100"
]]
/api/v1/series 和 /api/v1/label/<label_name>/values 区别
- series使用
Querier.Select然后grafana自身遍历 - 后者使用
LableQuerier.LabelValues提供标签查询
总结 5大数据查询接口
- 代码位置 web\api\v1\api.go
	r.Get("/query", wrap(api.query))
	r.Get("/query_range", wrap(api.queryRange))

	r.Get("/labels", wrap(api.labelNames))
	r.Get("/label/:name/values", wrap(api.labelValues))

	r.Get("/series", wrap(api.series))
本节重点总结 :
- 5大数据查询接口
- instant_query查询一个点
- range_query查询一段时间数据
- series查询 全量标签数据
- labels查询 标签key集合
- label values查询