容器监控方案 CAdvisor
2026/8/13大约 4 分钟
可观测性 · 第 8 篇
来源课程笔记整理优化;插图已迁入博客静态目录。
容器监控方案 CAdvisor
一、CAdvisor介绍

cAdvisor (Container Advisor) 是 Google 开源的一个容器监控工具,可用于对容器资源的使用情况和性能进行监控。它以守护进程方式运行,用于收集、聚合、处理和导出正在运行容器的有关信息。具体来说,该组件对每个容器都会记录其资源隔离参数、历史资源使用情况、完整历史资源使用情况的直方图和网络统计信息。
cAdvisor 本身就对 Docker 容器支持,并且还对其它类型的容器尽可能的提供支持,力求兼容与适配所有类型的容器。
cAdvisor 是用于监控容器引擎的。由于其监控的实用性,Kubernetes 已经默认将其与 Kubelet 融合,所以在K8S中无需再单独部署 cAdvisor 组件来暴露节点中容器运行的信息,直接使用 Kubelet 组件提供的指标采集地址即可。
二、CAdvisor准备
2.1 容器运行时 Docker准备
2.1.1 Docker安装YUM源准备
使用阿里云开源软件镜像站。
# wget https://mirrors.aliyun.com/docker-ce/linux/centos/docker-ce.repo -O /etc/yum.repos.d/docker-ce.repo2.1.2 Docker安装
# yum -y install docker-ce2.1.3 启动Docker服务
# systemctl enable --now docker2.1.4 使用docker命令查看容器占用主机资源情况
[root@container-host ~]# docker stats --no-stream nginxweb
CONTAINER ID   NAME       CPU %     MEM USAGE / LIMIT     MEM %     NET I/O          BLOCK I/O   PIDS
8939f74df636   nginxweb   2.89%     86.45MiB / 3.818GiB   2.21%     65.3MB / 3.6GB   0B / 0B     13
2.2 CAdvisor容器运行
docker run \
  --volume=/:/rootfs:ro \
  --volume=/var/run:/var/run:ro \
  --volume=/sys:/sys:ro \
  --volume=/var/lib/docker/:/var/lib/docker:ro \
  --volume=/dev/disk/:/dev/disk:ro \
  --volume=/etc/localtime:/etc/localtime \
  --publish=8080:8080 \
  --detach=true \
  --name=cadvisor \
  --privileged \
  --device=/dev/kmsg \
gcr.io/cadvisor/cadvisor:v0.46.0[root@container-host ~]# docker ps
CONTAINER ID IMAGE COMMAND CREATED STATUS PORTS NAMES
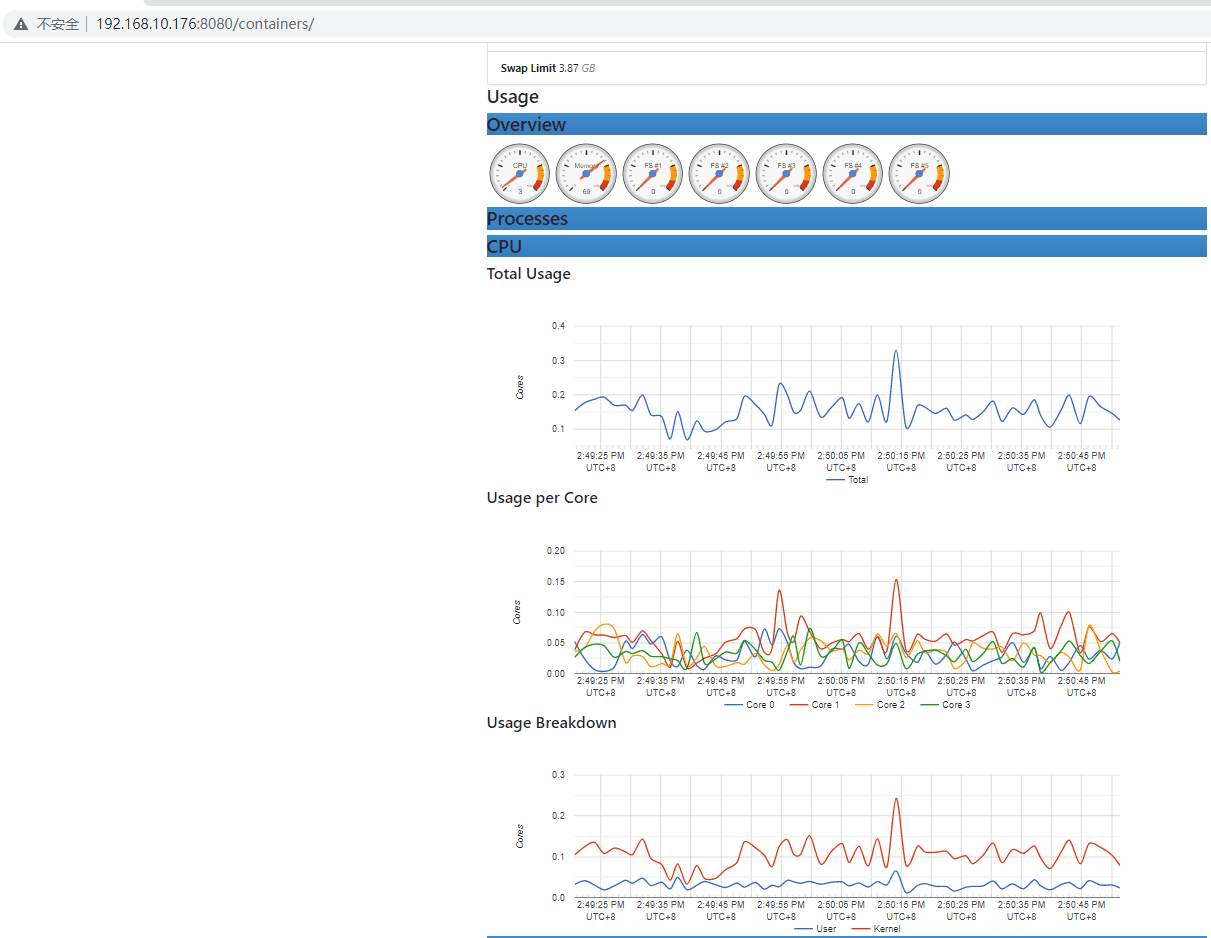
8939f74df636 gcr.io/cadvisor/cadvisor:v0.46.0 "/usr/bin/cadvisor -…" 7 minutes ago Up 7 minutes (healthy) 0.0.0.0:8080->8080/tcp, :::8080->8080/tcp cadvisor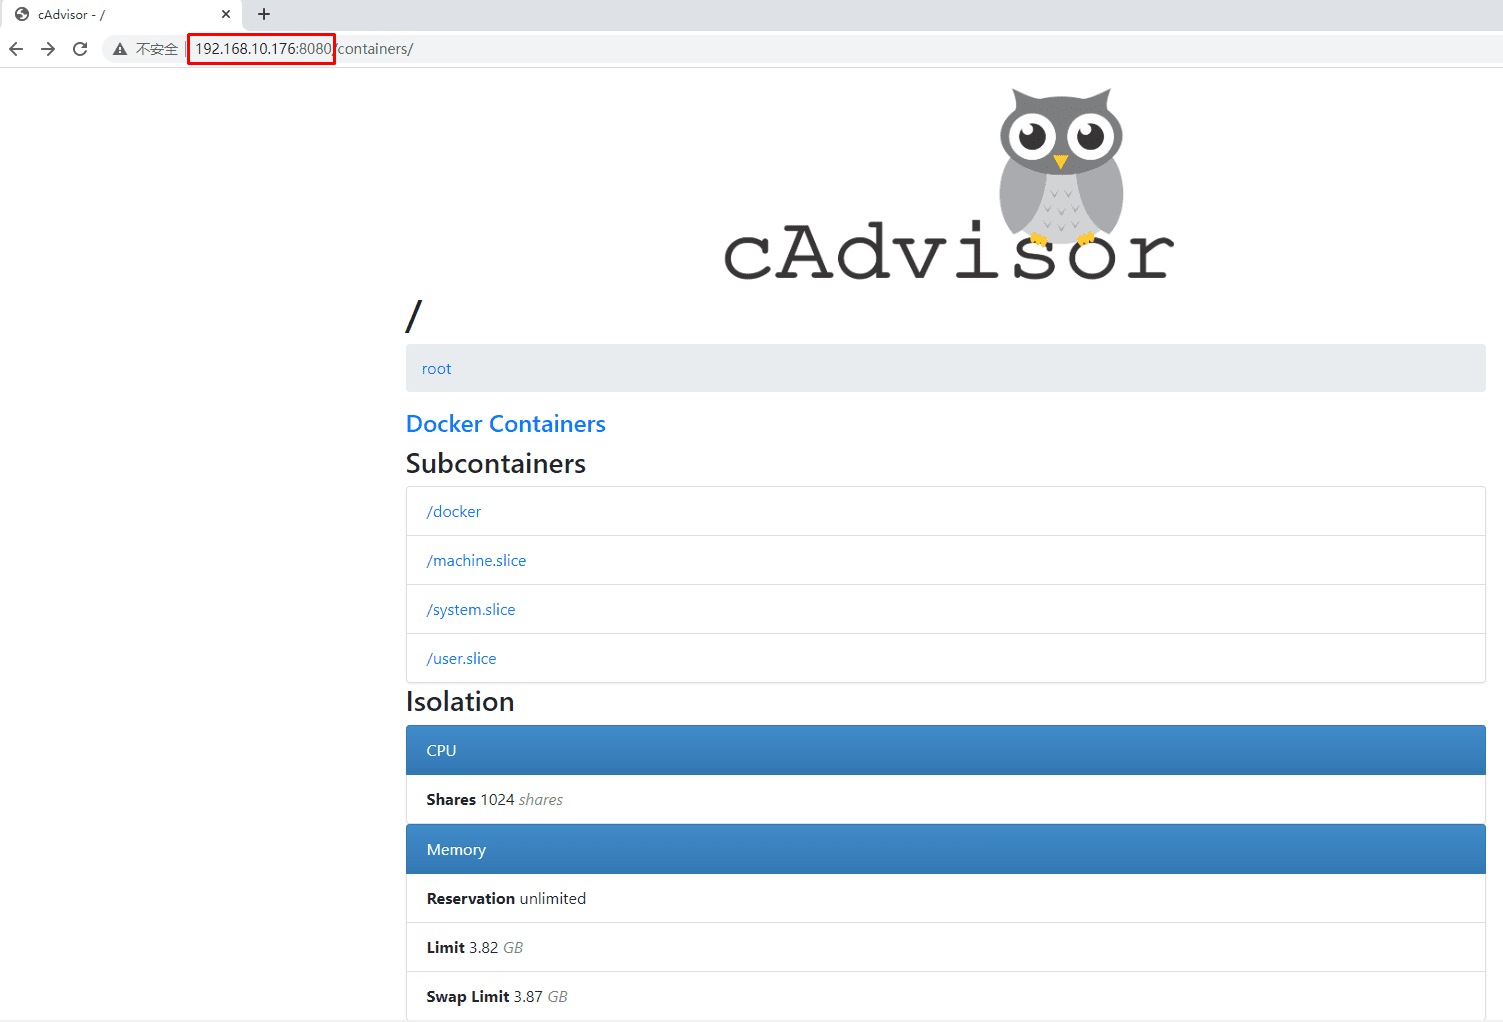
三、对接Prometheus监控系统
[root@monitorhost ~]# vim /opt/prometheus/config/prometheus.yml
[root@monitorhost ~]# cat /opt/prometheus/config/prometheus.yml
# my global config
global:
  scrape_interval: 15s # Set the scrape interval to every 15 seconds. Default is every 1 minute.
  evaluation_interval: 15s # Evaluate rules every 15 seconds. The default is every 1 minute.
  # scrape_timeout is set to the global default (10s).

# Alertmanager configuration
alerting:
  alertmanagers:
    - static_configs:
        - targets: ['192.168.10.174:9093']
          # - alertmanager:9093

# Load rules once and periodically evaluate them according to the global 'evaluation_interval'.
rule_files:
  # - "first_rules.yml"
  # - "second_rules.yml"
  - "/usr/local/prometheus/rules/*.yml"

# A scrape configuration containing exactly one endpoint to scrape:
# Here it's Prometheus itself.
scrape_configs:
  # The job name is added as a label `job=<job_name>` to any timeseries scraped from this config.
  - job_name: "prometheus"

    # metrics_path defaults to '/metrics'
    # scheme defaults to 'http'.

    static_configs:
      - targets: ["192.168.10.174:9090"]

  - job_name: "node_exporter_otherhost"
    static_configs:
      - targets: ["192.168.10.175:9100"]

  - job_name: "container-host-1"
    static_configs:
- targets: ["192.168.10.176:8080"][root@monitorhost ~]# docker ps
CONTAINER ID IMAGE COMMAND CREATED STATUS PORTS NAMES
710a61a7537d prom/prometheus:latest "/bin/prometheus --s…" 27 hours ago Up 26 hours 0.0.0.0:9090->9090/tcp, :::9090->9090/tcp unruffled_fermat[root@monitorhost ~]# docker restart 710a61a7537d
710a61a7537d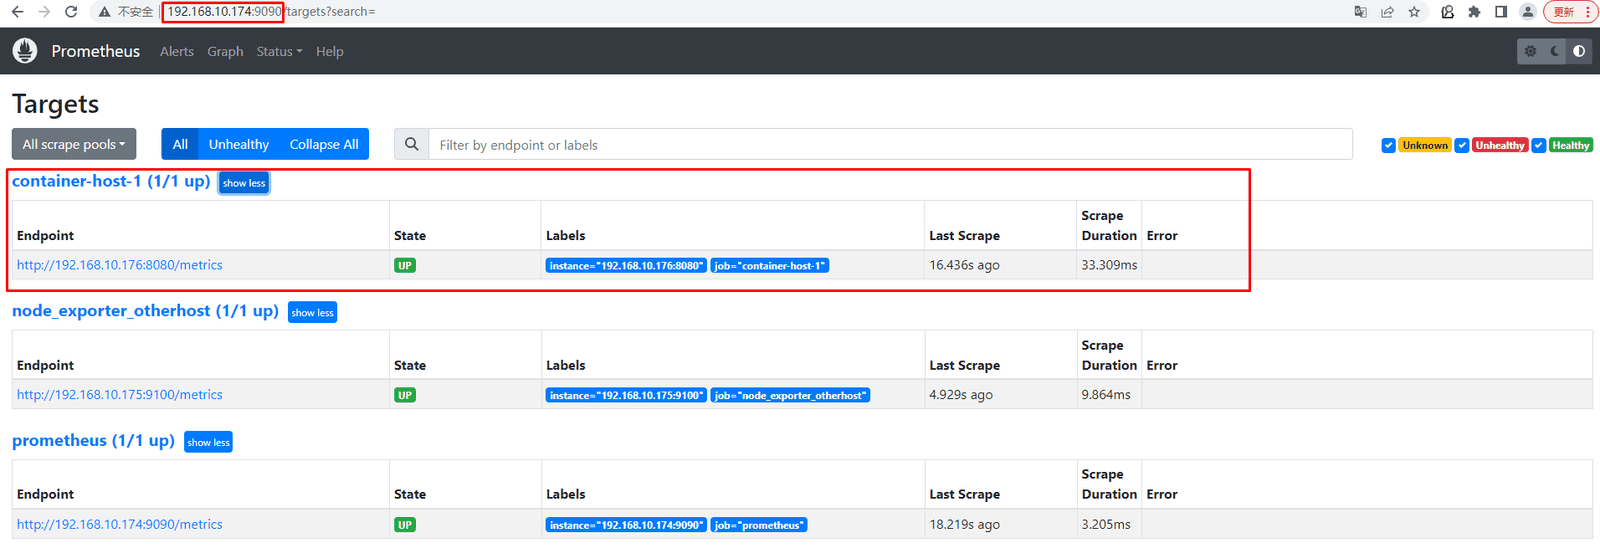
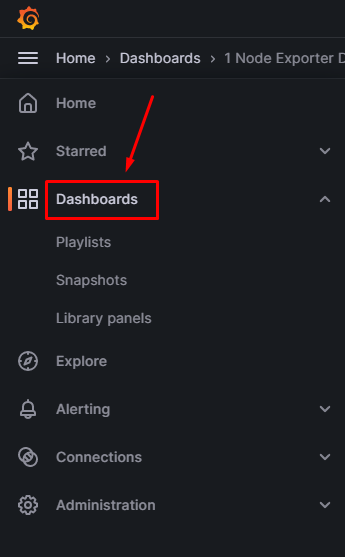
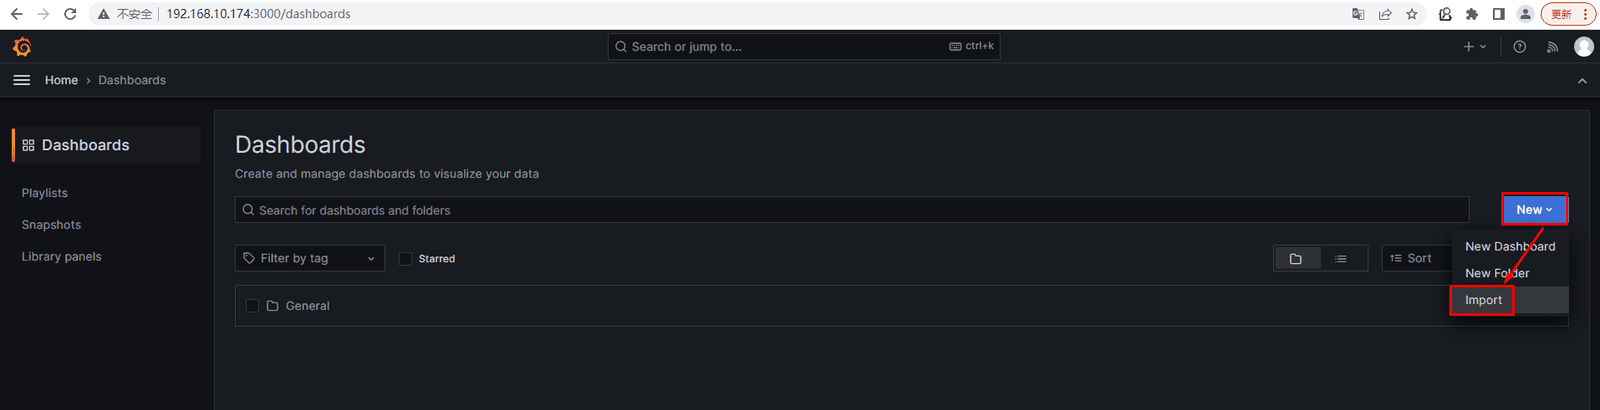
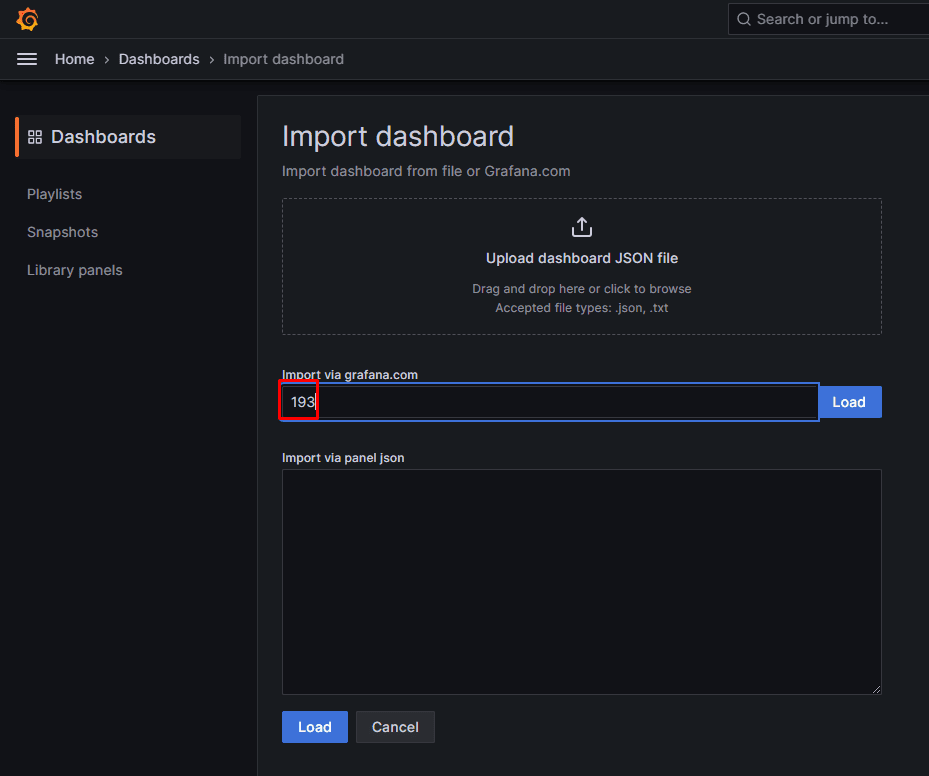
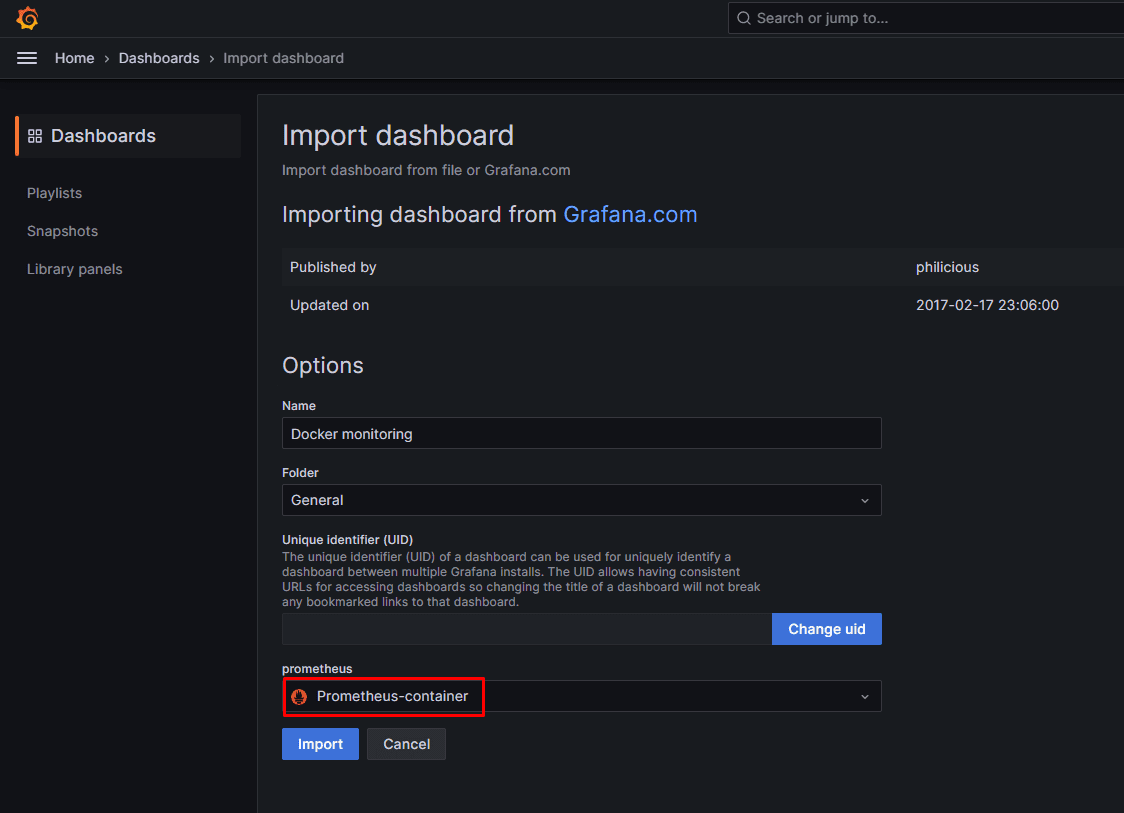
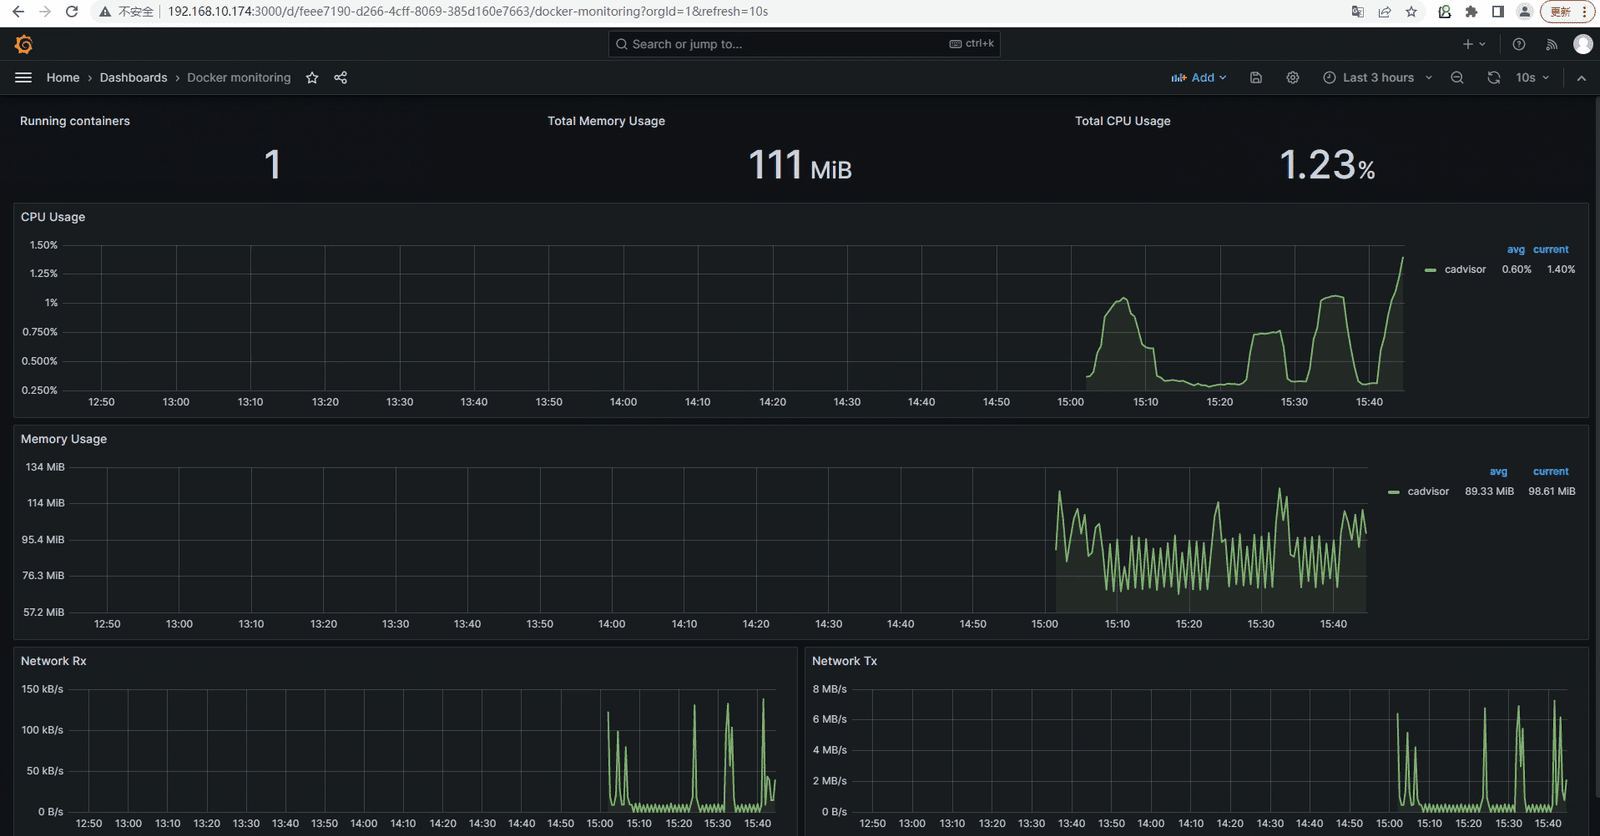
四、通过Grafana展示
使用193或11600或893或11558或10619均可。
五、运行web容器
[root@container-host ~]# docker run -d nginx:latest[root@container-host ~]# docker ps
CONTAINER ID IMAGE COMMAND CREATED STATUS PORTS NAMES
e288c2d2cacf nginx:latest "/docker-entrypoint.…" 38 seconds ago Up 37 seconds 80/tcp festive_wescoff
8939f74df636 gcr.io/cadvisor/cadvisor:v0.46.0 "/usr/bin/cadvisor -…" 2 hours ago Up 2 hours (healthy) 0.0.0.0:8080->8080/tcp, :::8080->8080/tcp cadvisor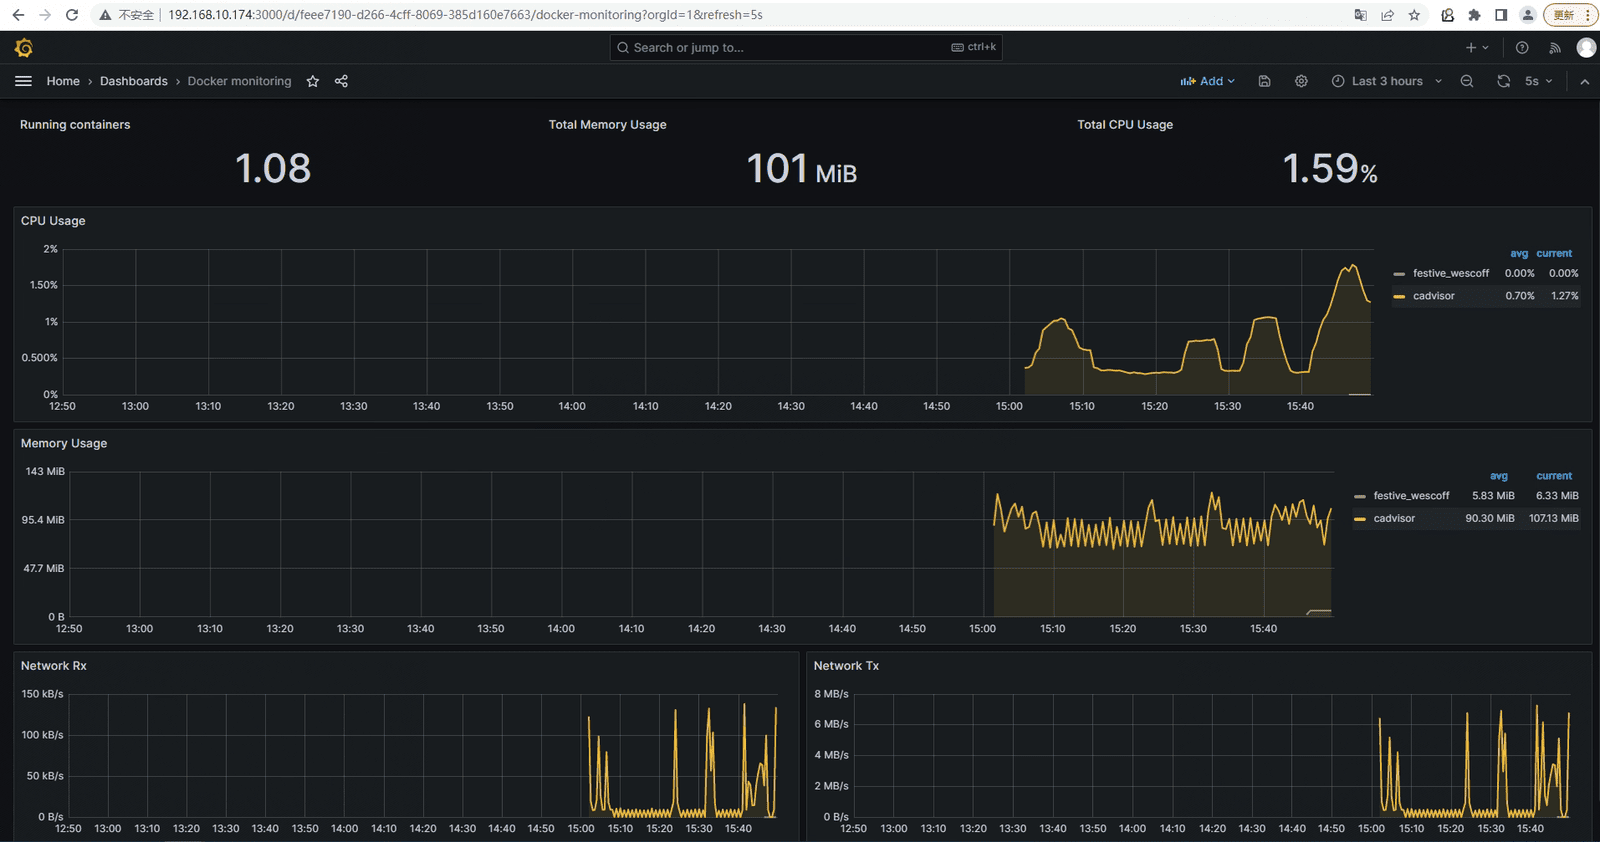
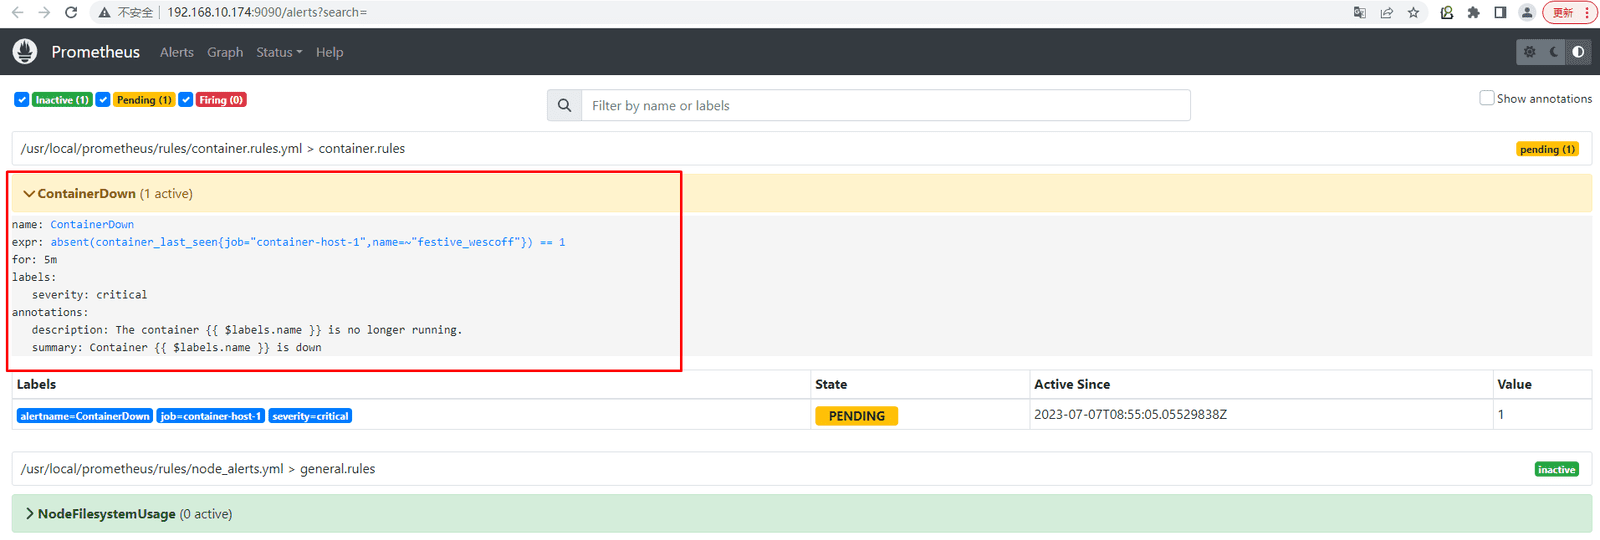
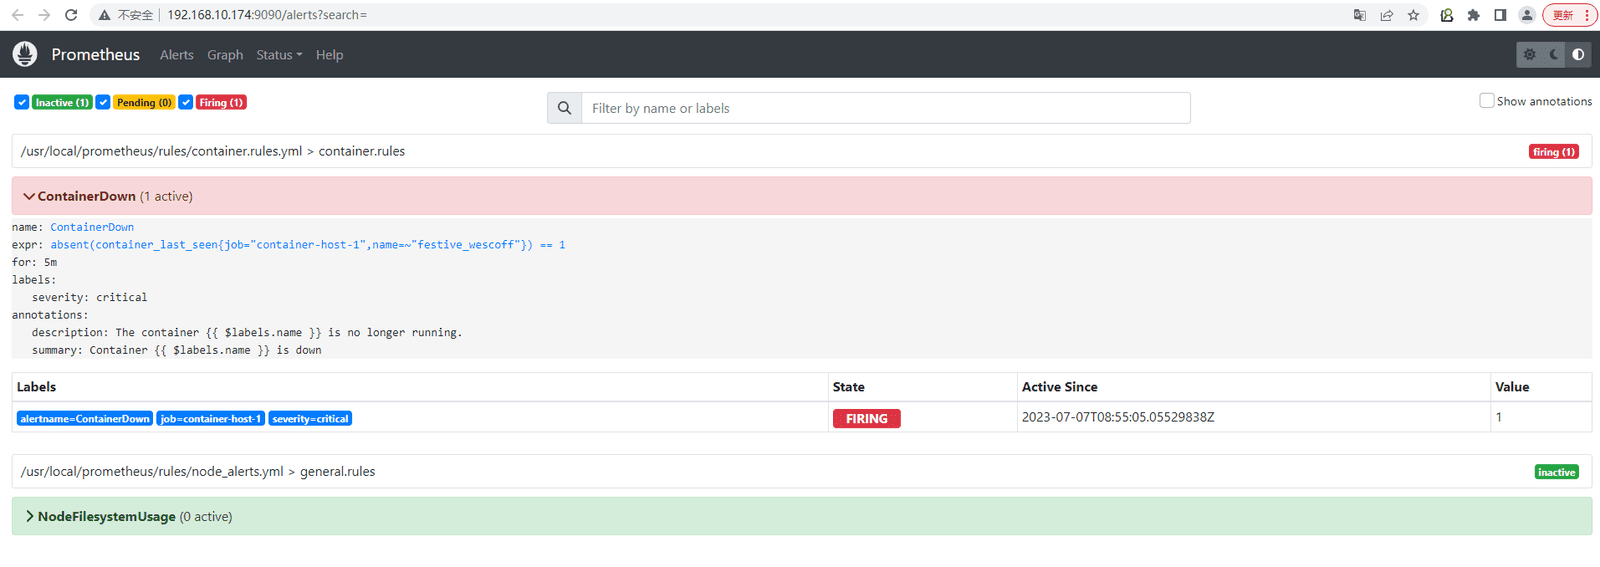
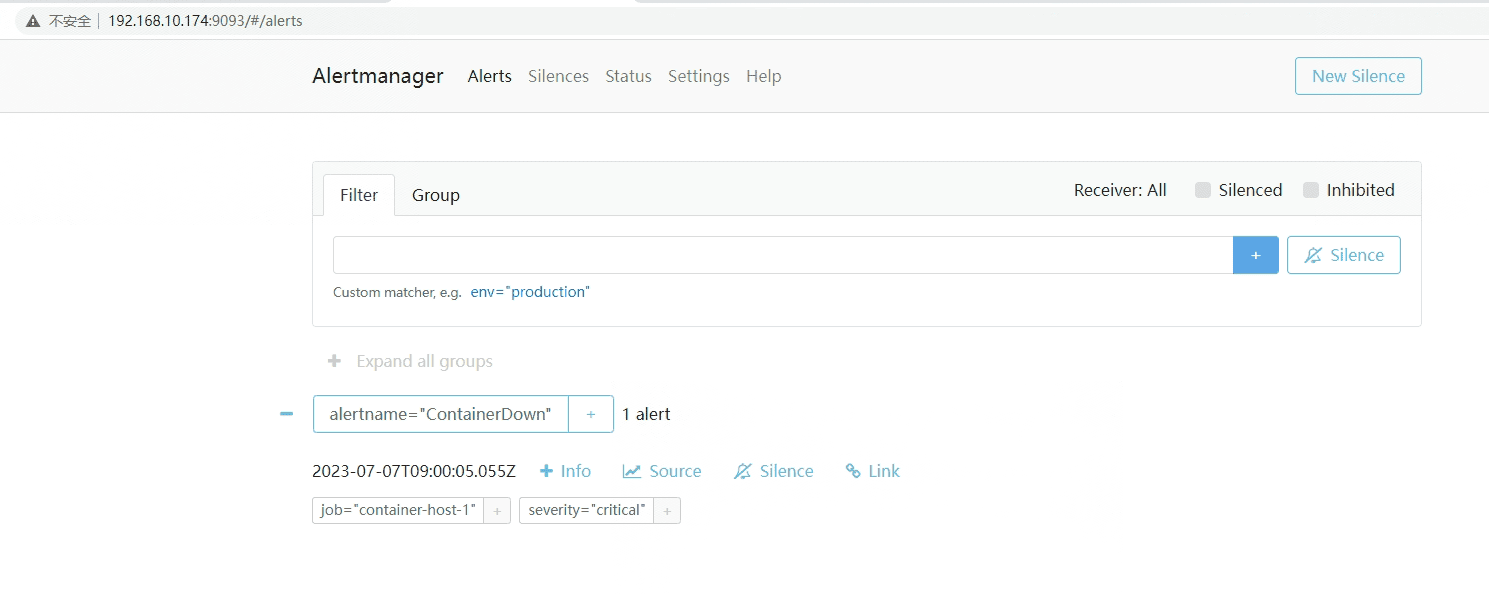
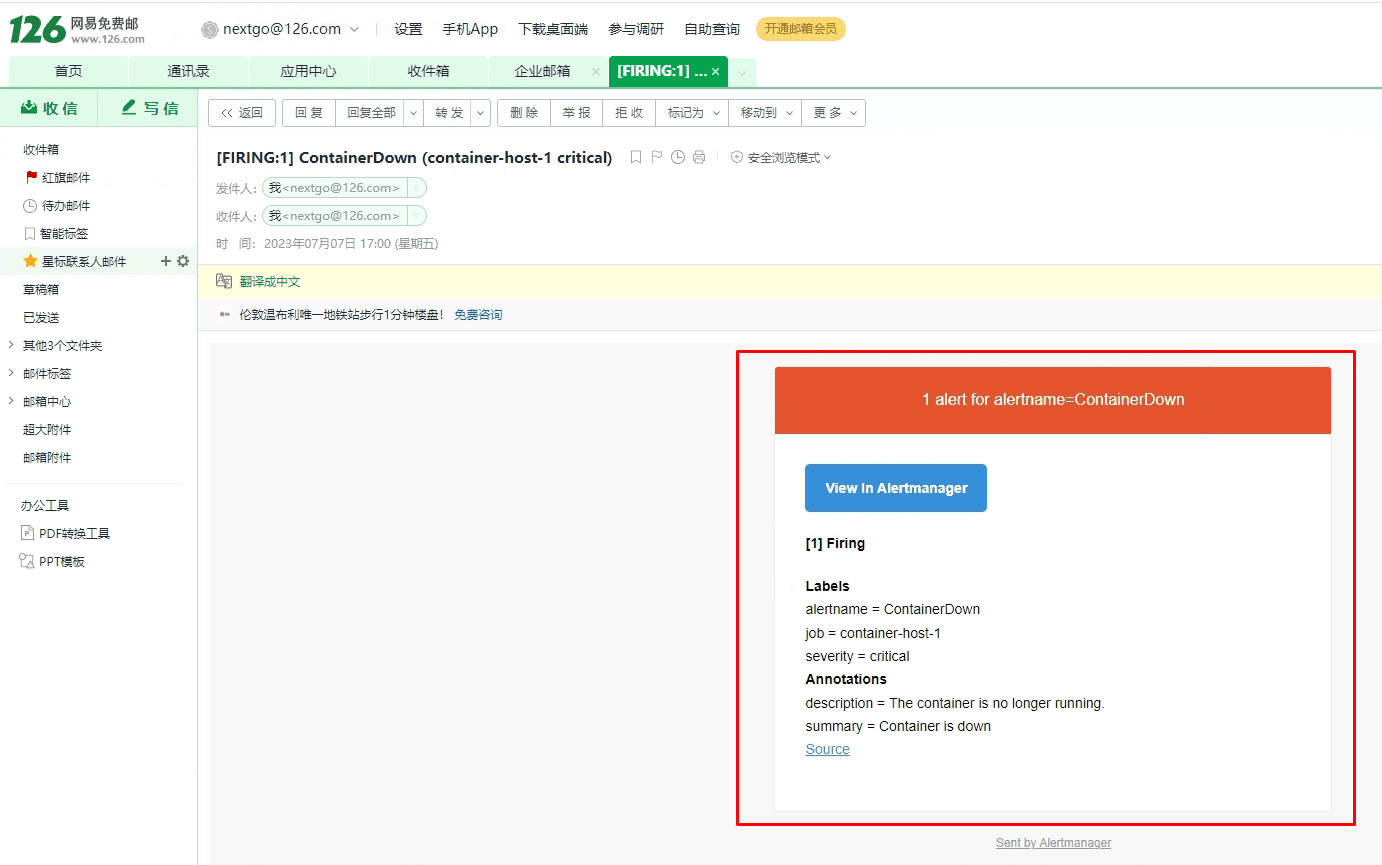
六、容器故障告警配置
[root@monitorhost ~]# vim /opt/prometheus/rules/container.rules.yml
[root@monitorhost ~]# cat /opt/prometheus/rules/container.rules.yml
groups:
- name: container.rules
rules:
- alert: ContainerDown
expr: absent(container_last_seen{job="container-host-1", name=~"festive_wescoff"}) == 1
for: 5m
labels:
severity: critical
annotations:
summary: "Container {{ $labels.name }} is down"
description: "The container {{ $labels.name }} is no longer running."[root@monitorhost ~]# docker ps
CONTAINER ID IMAGE COMMAND CREATED STATUS PORTS NAMES
710a61a7537d prom/prometheus:latest "/bin/prometheus --s…" 28 hours ago Up 2 hours 0.0.0.0:9090->9090/tcp, :::9090->9090/tcp unruffled_fermat
[root@monitorhost ~]# docker restart 710a61a7537d
710a61a7537d
[root@container-host ~]# docker ps
CONTAINER ID   IMAGE                              COMMAND                   CREATED             STATUS                 PORTS                                       NAMES
e288c2d2cacf   nginx:latest                       "/docker-entrypoint.…"   About an hour ago   Up About an hour       80/tcp                                      festive_wescoff

[root@container-host ~]# docker stop festive_wescoff
festive_wescoff