Prometheus安装
可观测性 · 第 2 篇
来源课程笔记整理优化;插图已迁入博客静态目录。
Prometheus安装及使用
一、Prometheus简介
1.1 Prometheus是什么
Prometheus是一个开源系统监控和警报工具,最初由 SoundCloud创建。自 2012 年以来,许多公司和组织都采用了 Prometheus,该项目拥有非常活跃的开发者和用户社区。
它现在是一个独立的开源项目,独立于任何公司进行维护。为了强调这一点,并明确项目的治理结构,Prometheus 于 2016 年作为继Kubernetes之后的第二个托管项目加入了云原生计算基金会(CNCF)。
Prometheus 将其指标收集并存储为时间序列数据,即指标信息与记录时的时间戳以及称为标签的可选键值对一起存储。
1.2 Prometheus特证
- 多维数据模型,使用指标名称和键值对标识时间序列数据。
- 灵活的查询语言PromQL,可以利用数据的多维特性进行查询。
- 不依赖分布式存储,单个服务器节点是自治的。
- 通过HTTP的拉取模型进行时间序列数据的收集。
- 支持通过中间网关进行时间序列的推送。
- 可以通过服务发现或静态配置发现监控目标。
- 提供多种图形和仪表盘支持模式。
1.3 什么是指标?
通俗来说,指标是数值型的测量结果。时间序列意味着随着时间的推移记录变化。不同的应用程序需要测量的内容各不相同。对于一个网页服务器来说,可能是请求的响应时间;对于一个数据库来说,可能是活动连接数或活动查询数等。
指标在理解应用程序为什么以某种方式工作中起着重要作用。假设你在运行一个网络应用程序,并发现应用程序很慢。你需要一些信息来找出应用程序出了什么问题。例如,当请求的数量很大时,应用程序可能变慢。如果你有请求计数的指标,你可以找出原因,并增加服务器数量来处理负载。
1.4 Prometheus组件
普罗米修斯生态系统由多个组成部分组成,其中许多是可选的:
主要的Prometheus服务器,用于抓取和存储时间序列数据。
用于仪表化应用程序代码的客户端库。
用于支持短期作业的推送网关。
用于服务(如HAProxy、StatsD、Graphite等)的特定用途的导出器。
用于处理告警的告警管理器。
各种支持工具。
大部分Prometheus组件都是使用Go语言编写的,这使得它们易于构建和部署为静态二进制文件。
1.5 Prometheus架构

Prometheus可以直接从提供Prometheus兼容的HTTP端点的目标中抓取指标数据。这使得它可以收集各种指标,例如CPU使用率、内存消耗、请求延迟以及自定义的应用程序特定指标。此外,对于短暂的作业或无法直接访问的目标,Prometheus可以利用一个称为“推送网关”的中间组件。作业可以将其指标推送到推送网关,然后Prometheus定期从网关中抓取数据。
一旦Prometheus收集到指标数据,它会将其本地存储在时间序列数据库中。它根据指标名称和相关标签的组合来组织数据。这使得可以高效地查询和检索特定的指标或指标集。
Prometheus提供了一种强大的查询语言,称为PromQL(Prometheus查询语言),允许用户对收集到的数据执行复杂的查询和聚合操作。用户可以定义规则,对时间序列数据进行处理,生成新的衍生指标,执行聚合操作,或者根据特定条件计算告警。
为了可视化收集到的指标,并创建仪表盘,Prometheus可以与Grafana集成,Grafana是一个流行的开源数据可视化工具。Grafana可以通过其API消费Prometheus的数据,并创建丰富的可视化效果、图表和图形。它提供了一个用户友好的界面,用于探索和监控收集到的指标数据。
总而言之,Prometheus是一个功能强大的监控和告警工具,可以从被监控的作业或服务中收集指标数据,将其本地存储,并对数据进行规则处理,同时通过Grafana或其他API消费者进行可视化。这种组合为实时监控和故障排除应用程序和基础设施提供了强大的功能。
1.6 什么场景适用Prometheus?
Prometheus非常适合记录任何纯数字的时间序列。它适用于机器中心的监控,也适用于高度动态的面向服务的架构监控。在微服务的世界中,它对多维数据的收集和查询支持是其特点之一。
Prometheus的设计注重可靠性,它成为你在故障期间快速诊断问题的系统。每个Prometheus服务器都是独立的,不依赖于网络存储或其他远程服务。在基础架构的其他部分出现故障时,你可以依赖它,并且不需要建立复杂的基础设施来使用它。
1.7 什么场景不适用Prometheus?
Prometheus非常重视可靠性。即使在故障情况下,你仍然可以查看有关系统的可用统计信息。如果你需要100%的准确性,例如对每个请求进行计费,那么Prometheus可能不是一个好的选择,因为收集到的数据可能不够详细和完整。在这种情况下,你最好使用其他系统来收集和分析计费数据,而将Prometheus用于其他监控方面。
1.8 Prometheus官方网址
https://prometheus.io/docs/introduction/overview/
二、Prometheus安装环境准备
Linux主机操作系统为:CentOS7u9
| 序号 | 主机名 | 主机IP地址 | 角色 |
|---|---|---|---|
| 1 | prometheus-server | 192.168.10.170/24 | server |
| 2 | prometheus-agent | 192.168.10.171/24 | agent |
三、Prometheus安装
3.1 Prometheus server获取


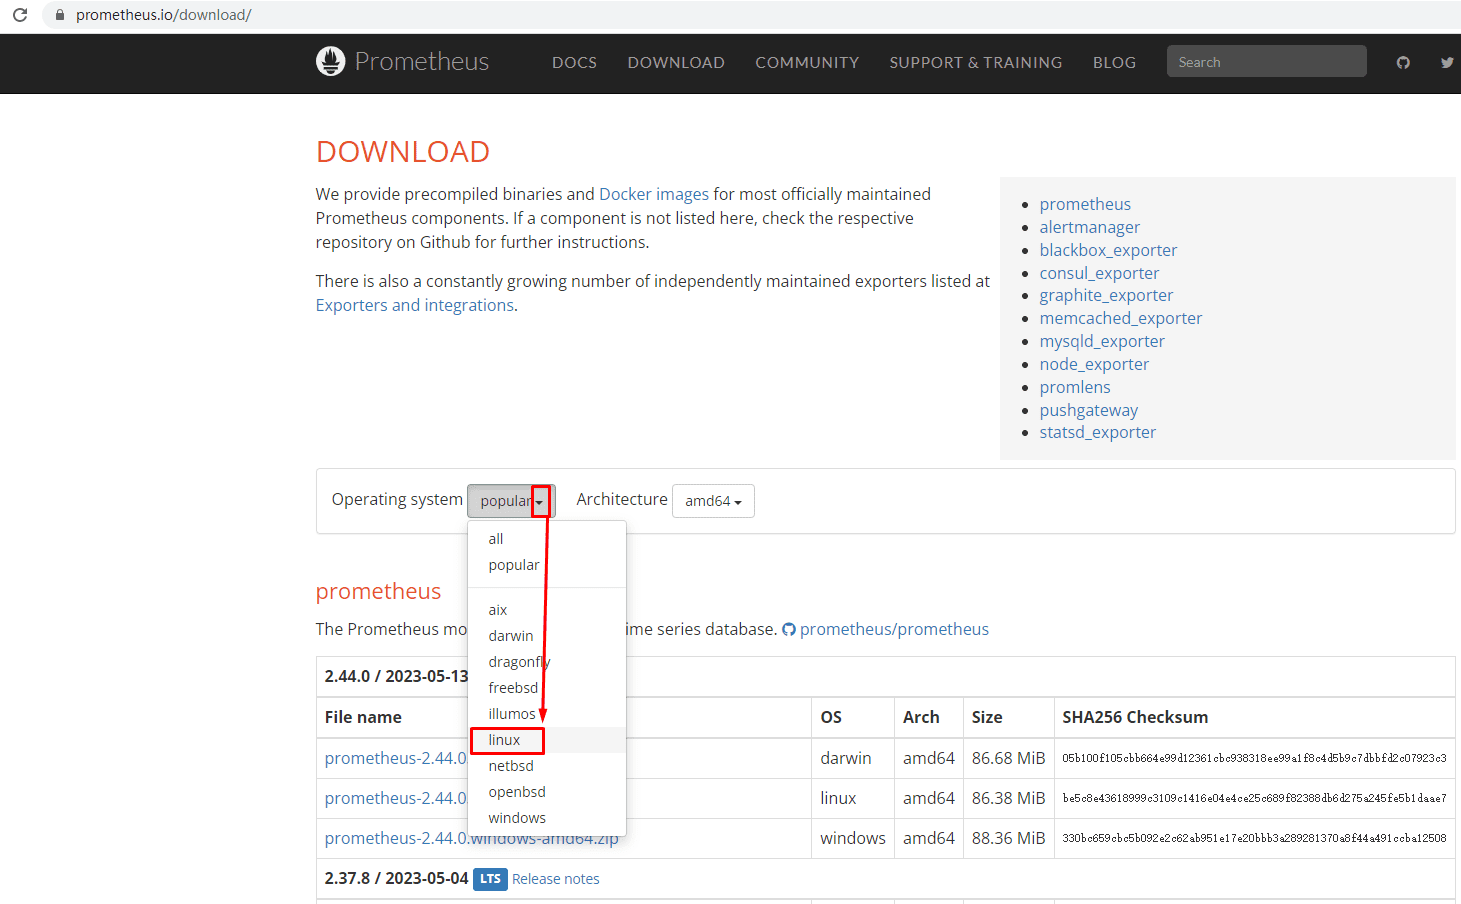
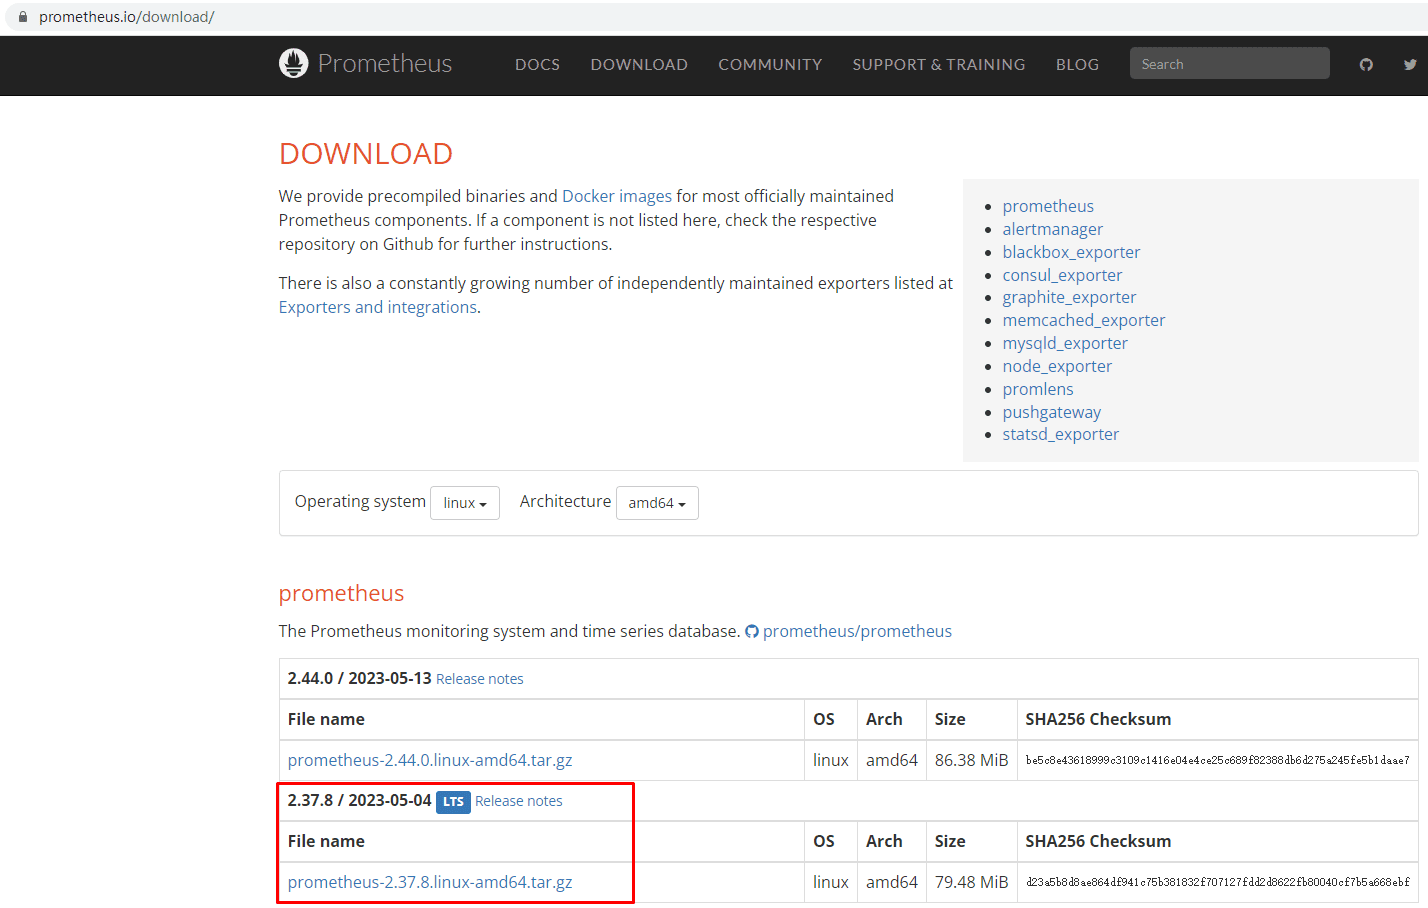
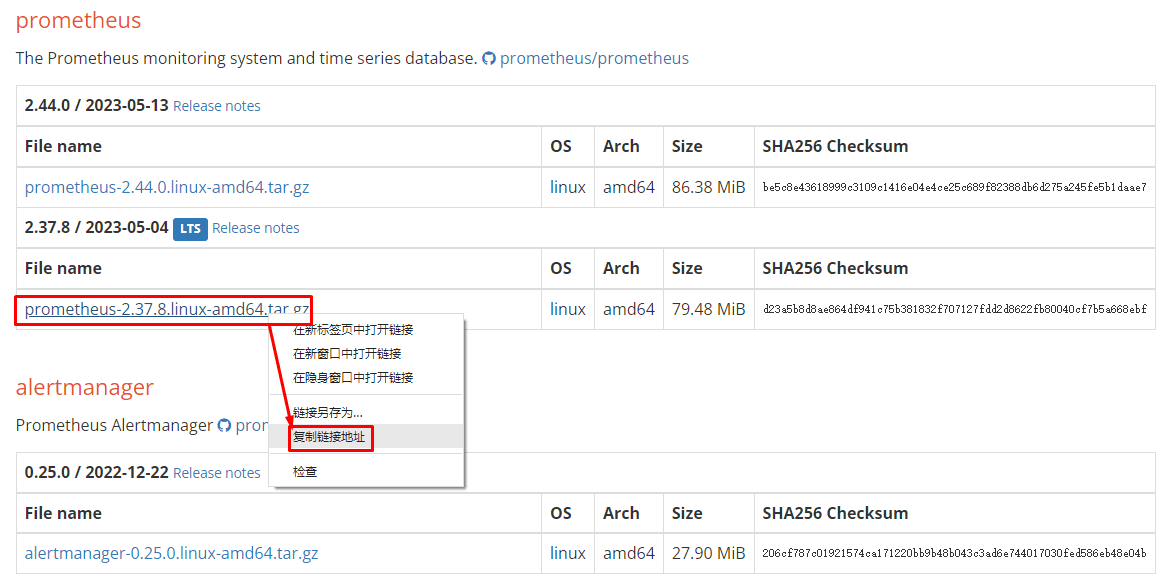
[root@prometheus-server ~]# wget https://github.com/prometheus/prometheus/releases/download/v2.37.8/prometheus-2.37.8.linux-amd64.tar.gz3.2 Prometheus安装
[root@prometheus-server ~]# tar xf prometheus-2.37.8.linux-amd64.tar.gz[root@prometheus-server ~]# mv prometheus-2.37.8.linux-amd64 /usr/local/src/prometheus[root@prometheus-server ~]# ls /usr/local/src/prometheus/
console_libraries consoles LICENSE NOTICE prometheus prometheus.yml promtool3.3 Prometheus启动
3.3.1 修改Prometheus配置文件
[root@prometheus-server ~]# cd /usr/local/src/prometheus/
[root@prometheus-server prometheus]# ls
console_libraries  consoles  LICENSE  NOTICE  prometheus  prometheus.yml  promtool
[root@prometheus-server prometheus]# vim prometheus.yml[root@prometheus-server prometheus]# cat prometheus.yml
# my global config
global:
scrape_interval: 15s # Set the scrape interval to every 15 seconds. Default is every 1 minute.
evaluation_interval: 15s # Evaluate rules every 15 seconds. The default is every 1 minute.
# scrape_timeout is set to the global default (10s).
# Alertmanager configuration
alerting:
alertmanagers:
- static_configs:
- targets:
# - alertmanager:9093
# Load rules once and periodically evaluate them according to the global 'evaluation_interval'.
rule_files:
# - "first_rules.yml"
# - "second_rules.yml"
# A scrape configuration containing exactly one endpoint to scrape:
# Here it's Prometheus itself.
scrape_configs:
# The job name is added as a label `job=<job_name>` to any timeseries scraped from this config.
- job_name: "prometheus"
# metrics_path defaults to '/metrics'
# scheme defaults to 'http'.
static_configs:
- targets: ["192.168.10.170:9090"] 把localhost修改为192.168.10.1703.3.2 启动Prometheus
[root@prometheus-server prometheus]# nohup ./prometheus --config.file=prometheus.yml &[root@prometheus-server prometheus]# ps aux | grep prometheus
root 29940 0.6 1.6 791544 67268 pts/1 Sl 19:31 0:00 ./prometheus --config.file=prometheus.yml[root@prometheus-server prometheus]# ss -anput | grep ":9090"
tcp ESTAB 0 0 192.168.10.170:50856 192.168.10.170:9090 users:(("prometheus",pid=29940,fd=10))
tcp LISTEN 0 4096 [::]:9090 [::]:* users:(("prometheus",pid=29940,fd=7))
tcp ESTAB 0 0 [::ffff:192.168.10.170]:9090 [::ffff:192.168.10.170]:50856 users:(("prometheus",pid=29940,fd=11))可以把Prometheus托管给systemd,如下所示:
注册为系统服务
[root@prometheus-server prometheus]# vim /usr/lib/systemd/system/prometheus.service
[root@prometheus-server prometheus]# cat > /usr/lib/systemd/system/prometheus.service << EOF
[Service]
ExecStart=/usr/local/src/prometheus/prometheus --config.file=/usr/local/src/prometheus/prometheus.yml

[Install]
WantedBy=multi-user.target

[Unit]
Description=prometheus
After=network.target
EOF重载/开机自启/查看状态/启动
[root@prometheus-server prometheus]# systemctl daemon-reload
[root@prometheus-server prometheus]# systemctl enable prometheus
[root@prometheus-server prometheus]# systemctl status prometheus
[root@prometheus-server prometheus]# systemctl start prometheus[root@prometheus-server prometheus]# lsof -i:9090
[root@prometheus-server prometheus]# ps -ef | grep prometheus四、Prometheus UI界面访问
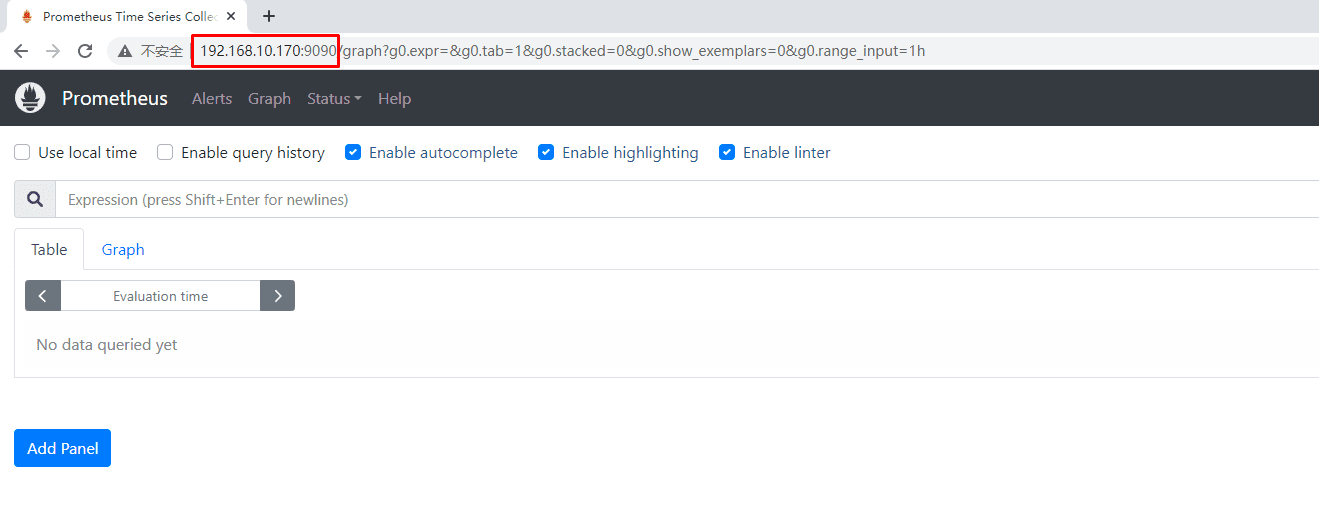
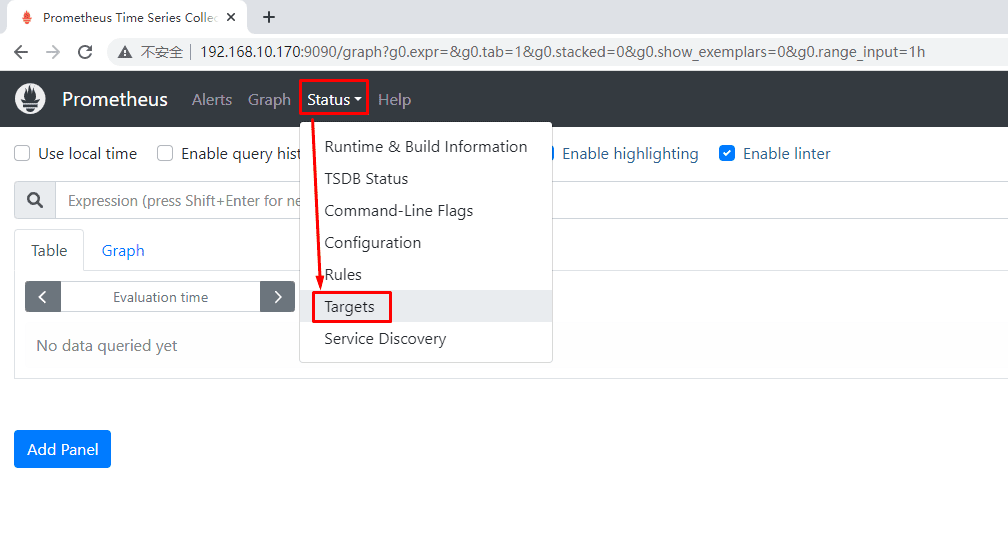
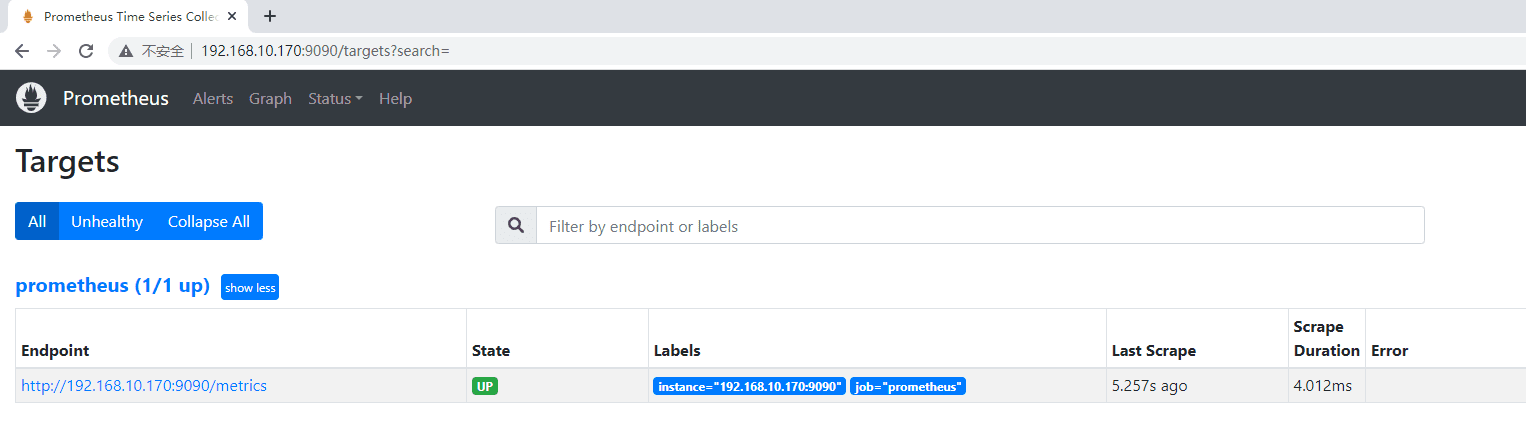
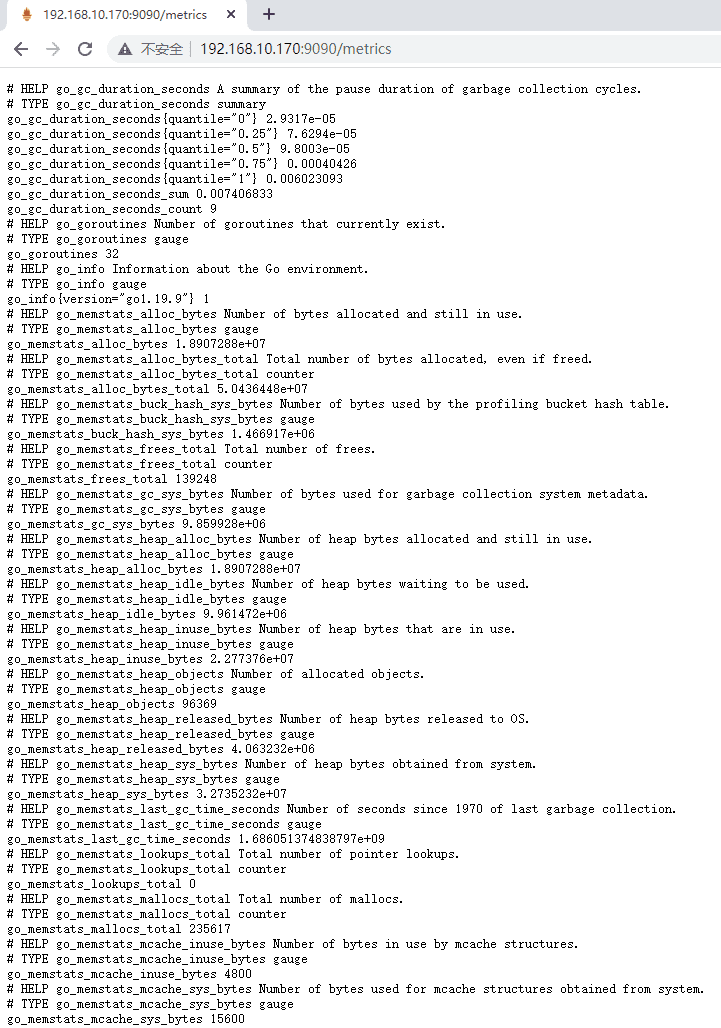
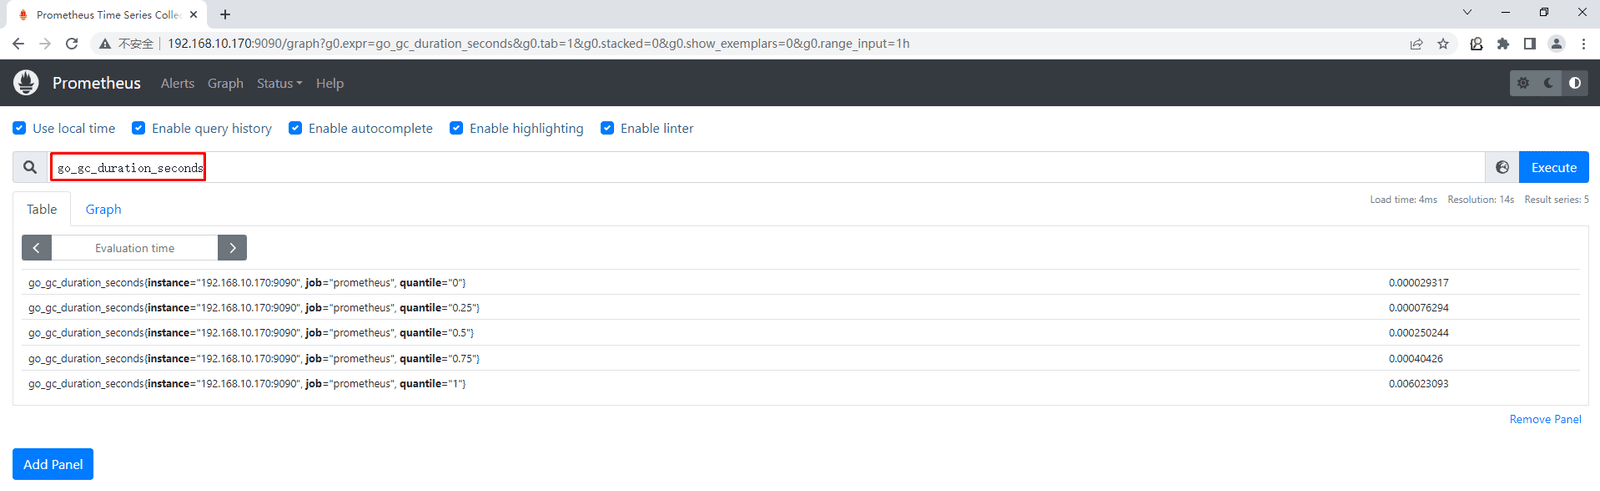
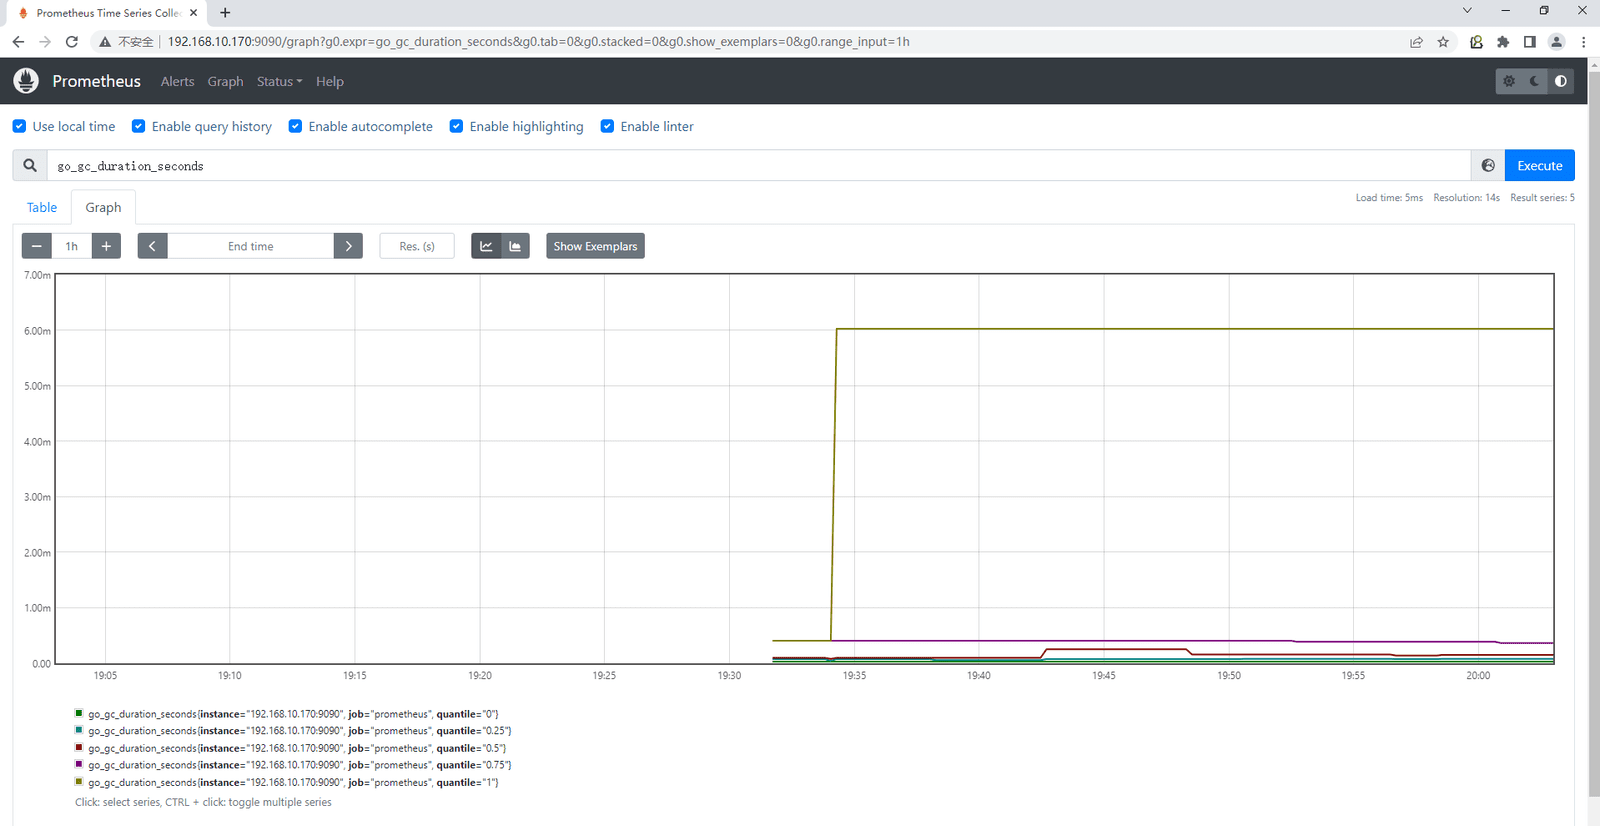
可以通过运行Prometheus server节点IP+9090端口对Prometheus进行访问。
五、使用Prometheus监控Prometheus server及其它主机
5.1 对Prometheus server主机监控
5.1.1 下载node_exporter

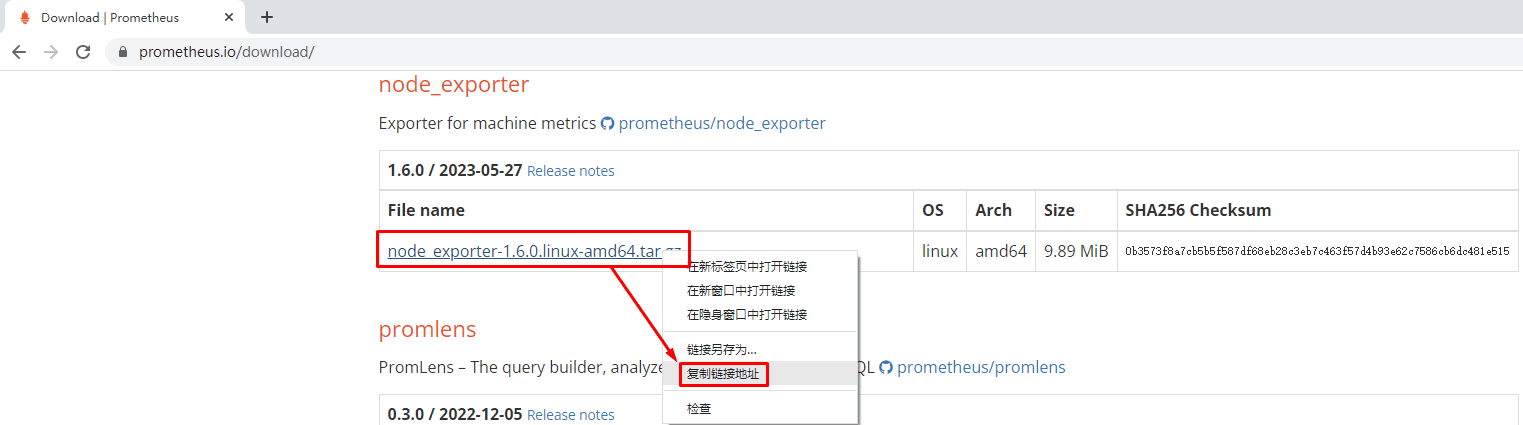
[root@prometheus-server ~]# wget https://github.com/prometheus/node_exporter/releases/download/v1.6.0/node_exporter-1.6.0.linux-amd64.tar.gz5.1.2 安装node_exporter
[root@prometheus-server ~]# tar xf node_exporter-1.6.0.linux-amd64.tar.gz

[root@prometheus-server ~]# ls
node_exporter-1.6.0.linux-amd64

[root@prometheus-server ~]# mv node_exporter-1.6.0.linux-amd64 /usr/local/src/node_exporter

[root@prometheus-server ~]# cd /usr/local/src/node_exporter/

[root@prometheus-server node_exporter]# ls
LICENSE  node_exporter  NOTICE
5.1.3 启动node_exporter
[root@prometheus-server node_exporter]# nohup ./node_exporter &[root@prometheus-server node_exporter]# ss -anput | grep "node_exporter"
tcp LISTEN 0 4096 [::]:9100 [::]:* users:(("node_exporter",pid=88088,fd=3))[root@prometheus-server node_exporter]# ss -anput | grep ":9100"
tcp LISTEN 0 4096 [::]:9100 [::]:* users:(("node_exporter",pid=88088,fd=3))也可以注册为systemd管理的系统服务
注册为系统服务
[root@prometheus-server node_exporter]# vim /usr/lib/systemd/system/node_exporter.service
[root@prometheus-server node_exporter]# cat > /usr/lib/systemd/system/node_exporter.service << EOF
[Service]
ExecStart=/usr/local/src/node_exporter/node_exporter

[Install]
WantedBy=multi-user.target

[Unit]
Description=node_exporter
After=network.target
EOF重载/开机自启/查看状态/启动
[root@prometheus-server node_exporter]# systemctl daemon-reload
[root@prometheus-server node_exporter]# systemctl enable node_exporter
[root@prometheus-server node_exporter]# systemctl status node_exporter
[root@prometheus-server node_exporter]# systemctl start node_exporter5.1.4 修改Prometheus Server配置文件添加node节点
[root@prometheus-server node_exporter]# cd /usr/local/src/prometheus/
[root@prometheus-server prometheus]# ls
console_libraries  consoles  data  LICENSE  NOTICE  prometheus  prometheus.yml  promtool
[root@prometheus-server prometheus]# vim prometheus.yml
[root@prometheus-server prometheus]# cat prometheus.yml
# my global config
global:
  scrape_interval: 15s # Set the scrape interval to every 15 seconds. Default is every 1 minute.
  evaluation_interval: 15s # Evaluate rules every 15 seconds. The default is every 1 minute.
  # scrape_timeout is set to the global default (10s).

# Alertmanager configuration
alerting:
  alertmanagers:
    - static_configs:
        - targets:
          # - alertmanager:9093

# Load rules once and periodically evaluate them according to the global 'evaluation_interval'.
rule_files:
  # - "first_rules.yml"
  # - "second_rules.yml"

# A scrape configuration containing exactly one endpoint to scrape:
# Here it's Prometheus itself.
scrape_configs:
  # The job name is added as a label `job=<job_name>` to any timeseries scraped from this config.
  - job_name: "prometheus"

    # metrics_path defaults to '/metrics'
    # scheme defaults to 'http'.

    static_configs:
      - targets: ["192.168.10.170:9090"]

  添加node节点监控配置
  - job_name: "prometheus-server"
    static_configs:
- targets: ["192.168.10.170:9100"][root@prometheus-server prometheus]# pkill prometheus[root@prometheus-server prometheus]# ./prometheus --config.file=prometheus.yml &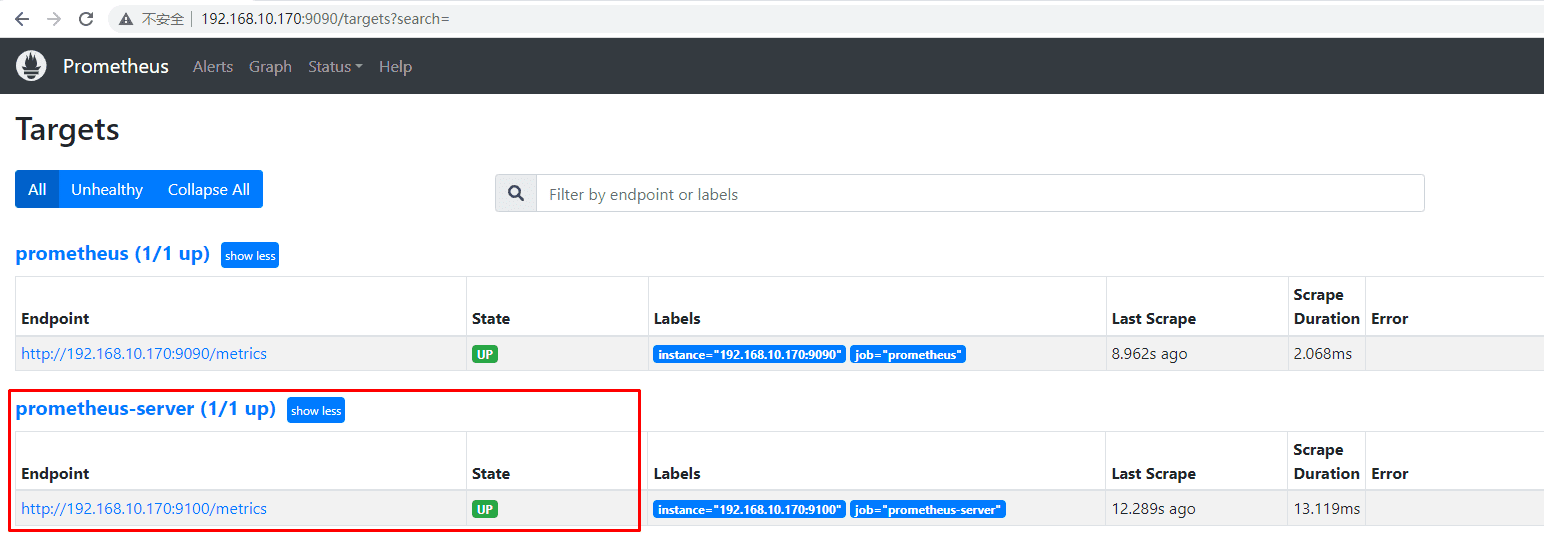
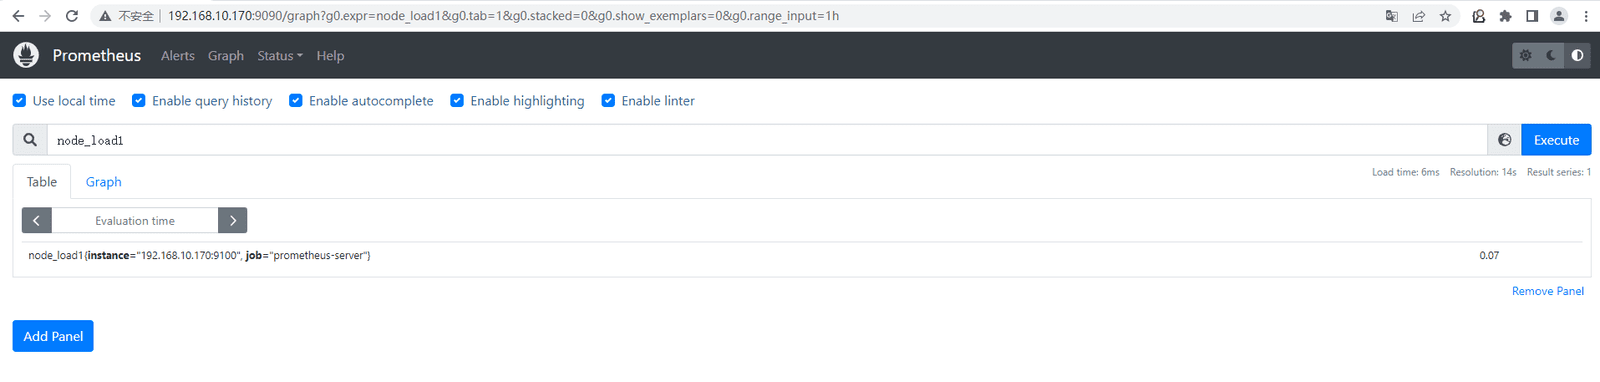
5.2 对其它主机进行监控
5.2.1 下载node_exporter
[root@prometheus-agent ~]# wget https://github.com/prometheus/node_exporter/releases/download/v1.6.0/node_exporter-1.6.0.linux-amd64.tar.gz5.1.2 安装node_exporter
[root@prometheus-agent ~]# tar xf node_exporter-1.6.0.linux-amd64.tar.gz

[root@prometheus-agent ~]# ls
node_exporter-1.6.0.linux-amd64

[root@prometheus-agent ~]# mv node_exporter-1.6.0.linux-amd64 /usr/local/src/node_exporter

[root@prometheus-agent ~]# cd /usr/local/src/node_exporter/

[root@prometheus-agent  node_exporter]# ls
LICENSE  node_exporter  NOTICE
5.1.3 启动node_exporter
[root@prometheus-agent node_exporter]# nohup ./node_exporter &[root@prometheus-agent node_exporter]# ss -anput | grep "node_exporter"
tcp LISTEN 0 4096 [::]:9100 [::]:* users:(("node_exporter",pid=88088,fd=3))[root@prometheus-agent node_exporter]# ss -anput | grep ":9100"
tcp LISTEN 0 4096 [::]:9100 [::]:* users:(("node_exporter",pid=88088,fd=3))也可以注册为systemd服务,便于管理
注册为系统服务
[root@prometheus-agent node_exporter]# vim /usr/lib/systemd/system/node_exporter.service
[root@prometheus-agent node_exporter]# cat > /usr/lib/systemd/system/node_exporter.service << EOF
[Service]
ExecStart=/usr/local/src/node_exporter/node_exporter

[Install]
WantedBy=multi-user.target

[Unit]
Description=node_exporter
After=network.target
EOF重载/开机自启/查看状态/启动
[root@prometheus-agent node_exporter]# systemctl daemon-reload
[root@prometheus-agent node_exporter]# systemctl enable node_exporter
[root@prometheus-agent node_exporter]# systemctl status node_exporter
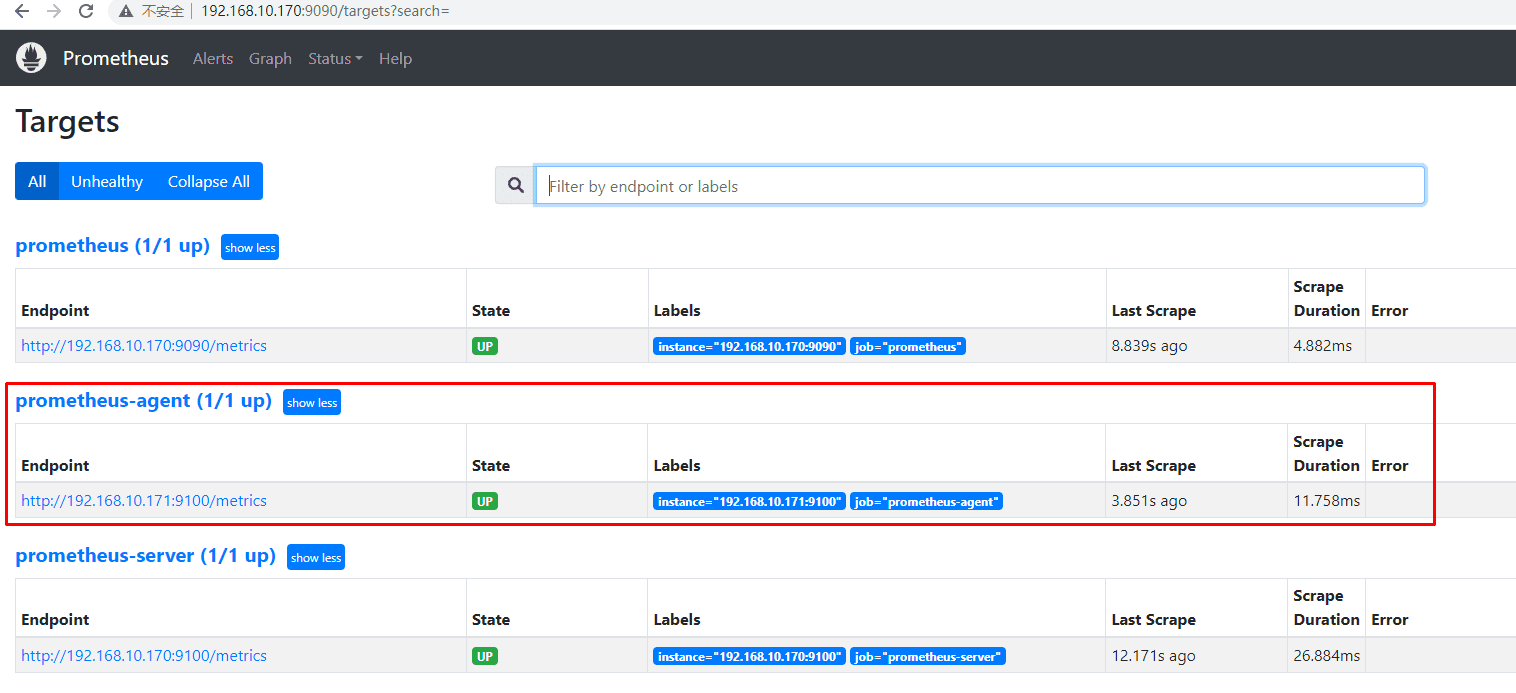
[root@prometheus-agent node_exporter]# systemctl start node_exporter5.1.4 修改Prometheus Server配置文件添加node节点
[root@prometheus-server node_exporter]# cd /usr/local/src/prometheus/
[root@prometheus-server prometheus]# ls
console_libraries  consoles  data  LICENSE  NOTICE  prometheus  prometheus.yml  promtool
[root@prometheus-server prometheus]# vim prometheus.yml
[root@prometheus-server prometheus]# cat prometheus.yml
# my global config
global:
  scrape_interval: 15s # Set the scrape interval to every 15 seconds. Default is every 1 minute.
  evaluation_interval: 15s # Evaluate rules every 15 seconds. The default is every 1 minute.
  # scrape_timeout is set to the global default (10s).

# Alertmanager configuration
alerting:
  alertmanagers:
    - static_configs:
        - targets:
          # - alertmanager:9093

# Load rules once and periodically evaluate them according to the global 'evaluation_interval'.
rule_files:
  # - "first_rules.yml"
  # - "second_rules.yml"

# A scrape configuration containing exactly one endpoint to scrape:
# Here it's Prometheus itself.
scrape_configs:
  # The job name is added as a label `job=<job_name>` to any timeseries scraped from this config.
  - job_name: "prometheus"

    # metrics_path defaults to '/metrics'
    # scheme defaults to 'http'.

    static_configs:
      - targets: ["192.168.10.170:9090"]

  添加node节点监控配置
  - job_name: "prometheus-server"
    static_configs:
      - targets: ["192.168.10.170:9100"]
  添加node节点监控配置
  - job_name: "prometheus-agent"
    static_configs:
- targets: ["192.168.10.171:9100"][root@prometheus-server prometheus]# pkill prometheus[root@prometheus-server prometheus]# ./prometheus --config.file=prometheus.yml &