
Prometheus 第33章:联邦与 Remote
2026/8/13大约 35 分钟
Prometheus · 第 33 章(合并)
由原课程小节笔记合并,便于连续阅读。
33.4 为什么remote_read查询series比直接查询要慢很多和源码解读
本节重点介绍 :
- 为什么remote_read查询series比直接查询要慢很多
- remote_read源码解析
为什么remote_read 比 直接查询要慢很多
现象描述
- 查询脚本
import json
import time
import requests
import logging
import curlify

logging.basicConfig(
    format='%(asctime)s %(levelname)s %(filename)s [func:%(funcName)s] [line:%(lineno)d]:%(message)s',
    datefmt="%Y-%m-%d %H:%M:%S",
    level="INFO"
)

def label_values(host):
    uri = 'http://{}/api/v1/series'.format(host)
    end = int(time.time())
    start = end - 60 * 60 * 24 *20
    expr = '''{__name__=~".*a.*|.*e.*"}'''
    G_PARMS = {
        "match[]": expr,
        "start": start,
        "end": end,
    }
    res = requests.get(uri, G_PARMS, timeout=5)
    print(curlify.to_curl(res.request))
    tag_values = set()
    if res.status_code != 200:
        msg = "[error_code_not_200]"
        logging.error(msg)
        return
    jd = res.json()
    if not jd:
        msg = "[error_loads_json]"
        logging.error(msg)
        return
    # for i in jd.get("data"):
    #     tag_values.add(i.get(tag_key))
    # msg = "\n[prometheus_host:{}]\n[expr:{}]\n[target_tag:{}]\n[num:{}][tag_values:{}]".format(
    #     host,
    #     expr,
    #     tag_key,
    #     len(tag_values),
    #     tag_values)
    # logging.info(msg)
    return tag_values

if __name__ == '__main__':
    start = time.perf_counter()
    # label_values("192.168.3.200:9090")
    label_values("192.168.3.200:8090")
    end = time.perf_counter()
    haoshi = end - start
    msg = "耗时:{}".format(haoshi)
    logging.info(haoshi)
现象描述-series 接口对比
- 直接查询
curl -X GET -H 'Accept: */*' -H 'Accept-Encoding: gzip, deflate' -H 'Connection: keep-alive' -H 'User-Agent: python-requests/2.25.1' 'http://172.20.70.215:9090/api/v1/series?match%5B%5D=+%7B__name__%3D~%22.%2Aa.%2A%7C.%2Ae.%2A%22%7D+&start=1628563540&end=1628563840'
2021-08-10 10:50:48 INFO 001_series_query.py [func:label_values] [line:34]:请求 {__name__=~".*a.*|.*e.*"} 耗时:7.760190099999999- 通过prometheus remote_read查series结果
curl -X GET -H 'Accept: */*' -H 'Accept-Encoding: gzip, deflate' -H 'Connection: keep-alive' -H 'User-Agent: python-requests/2.25.1' 'http://172.20.70.215:8090/api/v1/series?match%5B%5D=+%7B__name__%3D~%22.%2Aa.%2A%7C.%2Ae.%2A%22%7D+&start=1628564145&end=1628564445'
2021-08-10 11:01:09 INFO 001_series_query.py [func:label_values] [line:34]:请求 {__name__=~".*a.*|.*e.*"} 耗时:23.1208281- 可以看出相同数据量的前提下 remote_read要慢 3倍
现象描述-query_range 接口对比
- 直接查询
curl -X GET -H 'Accept: */*' -H 'Accept-Encoding: gzip, deflate' -H 'Connection: keep-alive' -H 'User-Agent: python-requests/2.25.1' 'http://172.20.70.215:9090/api/v1/query_range?query=+avg%28rate%28node_cpu_seconds_total%5B2m%5D%29%29+by+%28instance%29+%2A100+&start=1628585656&end=1628589256&step=30'

2021-08-10 17:54:19 INFO 001_range_query.py [func:ins_query] [line:48]:请求 avg(rate(node_cpu_seconds_total[2m])) by (instance) *100 耗时:3.0241588999999998- 通过remote_read查询
curl -X GET -H 'Accept: */*' -H 'Accept-Encoding: gzip, deflate' -H 'Connection: keep-alive' -H 'User-Agent: python-requests/2.25.1' 'http://172.20.70.215:8090/api/v1/query_range?query=+avg%28rate%28node_cpu_seconds_total%5B2m%5D%29%29+by+%28instance%29+%2A100+&start=1628585590&end=1628589190&step=30'
2021-08-10 17:53:16 INFO 001_range_query.py [func:ins_query] [line:48]:请求 avg(rate(node_cpu_seconds_total[2m])) by (instance) *100 耗时:6.7678848- 结论:依旧是remote_read慢 一倍
思考
- 是否remote_read中做了额外的操作导致的?
源码追查
main中启动的 fanoutStorage
- D:\go_path\pkg\mod\github.com\prometheus\prometheus@v1.8.2-0.20210321183757-31a518faab18\cmd\prometheus\main.go
		remoteStorage = remote.NewStorage(log.With(logger, "component", "remote"), prometheus.DefaultRegisterer, localStorage.StartTime, cfg.localStoragePath, time.Duration(cfg.RemoteFlushDeadline), scraper)
		fanoutStorage = storage.NewFanout(logger, localStorage, remoteStorage)
fanoutStorage的new 方法
- D:\go_path\pkg\mod\github.com\prometheus\prometheus@v1.8.2-0.20210321183757-31a518faab18\storage\fanout.go
- 代码注释中写的很明白,如果primary存在,并且查询出错就不去 secondaries中查询了
- 如果 secondaries 中有的出错,那么只打个warning
// NewFanout returns a new fanout Storage, which proxies reads and writes
// through to multiple underlying storages.
//
// The difference between primary and secondary Storage is only for read (Querier) path and it goes as follows:
// * If the primary querier returns an error, then any of the Querier operations will fail.
// * If any secondary querier returns an error the result from that queries is discarded. The overall operation will succeed,
// and the error from the secondary querier will be returned as a warning.
//
// NOTE: In the case of Prometheus, it treats all remote storages as secondary / best effort.
func NewFanout(logger log.Logger, primary Storage, secondaries ...Storage) Storage {
	return &fanout{
		logger:      logger,
		primary:     primary,
		secondaries: secondaries,
	}
}- 在main中 fanoutStorage会被作为 web的storage
cfg.web.Storage = fanoutStoragefanoutStorage 的 Querier方法
- Querier方法是调用具体查询接口前获取 查询对象的方法
- fanoutStorage的 Querier方法
- D:\go_path\pkg\mod\github.com\prometheus\prometheus@v1.8.2-0.20210321183757-31a518faab18\storage\fanout.go
func (f *fanout) Querier(ctx context.Context, mint, maxt int64) (Querier, error) {
	primary, err := f.primary.Querier(ctx, mint, maxt)
	if err != nil {
		return nil, err
	}

	secondaries := make([]Querier, 0, len(f.secondaries))
	for _, storage := range f.secondaries {
		querier, err := storage.Querier(ctx, mint, maxt)
		if err != nil {
			// Close already open Queriers, append potential errors to returned error.
			errs := tsdb_errors.NewMulti(err, primary.Close())
			for _, q := range secondaries {
				errs.Add(q.Close())
			}
			return nil, errs.Err()
		}
		secondaries = append(secondaries, querier)
	}
	return NewMergeQuerier([]Querier{primary}, secondaries, ChainedSeriesMerge), nil
}- 会转化为NewMergeQuerier
merge 的 NewMergeQuerier方法
- D:\go_path\pkg\mod\github.com\prometheus\prometheus@v1.8.2-0.20210321183757-31a518faab18\storage\merge.go
func NewMergeQuerier(primaries []Querier, secondaries []Querier, mergeFn VerticalSeriesMergeFunc) Querier {
	queriers := make([]genericQuerier, 0, len(primaries)+len(secondaries))
	for _, q := range primaries {
		if _, ok := q.(noopQuerier); !ok && q != nil {
			queriers = append(queriers, newGenericQuerierFrom(q))
		}
	}
	for _, q := range secondaries {
		if _, ok := q.(noopQuerier); !ok && q != nil {
			queriers = append(queriers, newSecondaryQuerierFrom(q))
		}
	}

	concurrentSelect := false
	if len(secondaries) > 0 {
		concurrentSelect = true
	}
	return &querierAdapter{&mergeGenericQuerier{
		mergeFn:          (&seriesMergerAdapter{VerticalSeriesMergeFunc: mergeFn}).Merge,
		queriers:         queriers,
		concurrentSelect: concurrentSelect,
	}}
}- NewMergeQuerier 会被转化为 querierAdapter
- D:\go_path\pkg\mod\github.com\prometheus\prometheus@v1.8.2-0.20210321183757-31a518faab18\storage\merge.go
mergeGenericQuerier的select 方法是真正的series 查询动作,核心
- D:\go_path\pkg\mod\github.com\prometheus\prometheus@v1.8.2-0.20210321183757-31a518faab18\storage\merge.go
// Select returns a set of series that matches the given label matchers.
func (q *mergeGenericQuerier) Select(sortSeries bool, hints *SelectHints, matchers ...*labels.Matcher) genericSeriesSet {
	if len(q.queriers) == 0 {
		return noopGenericSeriesSet{}
	}
	if len(q.queriers) == 1 {
		return q.queriers[0].Select(sortSeries, hints, matchers...)
	}

	var seriesSets = make([]genericSeriesSet, 0, len(q.queriers))
	if !q.concurrentSelect {
		for _, querier := range q.queriers {
			// We need to sort for merge  to work.
			seriesSets = append(seriesSets, querier.Select(true, hints, matchers...))
		}
		return &lazyGenericSeriesSet{init: func() (genericSeriesSet, bool) {
			s := newGenericMergeSeriesSet(seriesSets, q.mergeFn)
			return s, s.Next()
		}}
	}

	var (
		wg            sync.WaitGroup
		seriesSetChan = make(chan genericSeriesSet)
	)
	// Schedule all Selects for all queriers we know about.
	for _, querier := range q.queriers {
		wg.Add(1)
		go func(qr genericQuerier) {
			defer wg.Done()

			// We need to sort for NewMergeSeriesSet to work.
			seriesSetChan <- qr.Select(true, hints, matchers...)
		}(querier)
	}
	go func() {
		wg.Wait()
		close(seriesSetChan)
	}()

	for r := range seriesSetChan {
		seriesSets = append(seriesSets, r)
	}
	return &lazyGenericSeriesSet{init: func() (genericSeriesSet, bool) {
		s := newGenericMergeSeriesSet(seriesSets, q.mergeFn)
		return s, s.Next()
	}}
}- 如果我们没有配置remote_read ,那么就会走这里,也就是只查询 primary
	if len(q.queriers) == 1 {
		return q.queriers[0].Select(sortSeries, hints, matchers...)
}- 那么对应查询的就是block
- D:\go_path\pkg\mod\github.com\prometheus\prometheus@v1.8.2-0.20210220213500-8c8de46003d1\tsdb\querier.go
func (q *blockQuerier) Select(sortSeries bool, hints *storage.SelectHints, ms ...*labels.Matcher) storage.SeriesSet {
	mint := q.mint
	maxt := q.maxt
	p, err := PostingsForMatchers(q.index, ms...)
	if err != nil {
		return storage.ErrSeriesSet(err)
	}
	if sortSeries {
		p = q.index.SortedPostings(p)
	}

	if hints != nil {
		mint = hints.Start
		maxt = hints.End
		if hints.Func == "series" {
			// When you're only looking up metadata (for example series API), you don't need to load any chunks.
			return newBlockSeriesSet(q.index, newNopChunkReader(), q.tombstones, p, mint, maxt)
		}
	}

	return newBlockSeriesSet(q.index, q.chunks, q.tombstones, p, mint, maxt)
}
那么如果配置了remote_read的接口会怎么样
- 会走 mergeGenericQuerier.Select底部代码
	return &lazyGenericSeriesSet{init: func() (genericSeriesSet, bool) {
		s := newGenericMergeSeriesSet(seriesSets, q.mergeFn)
		return s, s.Next()
}}- 也就是 newGenericMergeSeriesSet这个方法
- D:\go_path\pkg\mod\github.com\prometheus\prometheus@v1.8.2-0.20210321183757-31a518faab18\storage\merge.go
// newGenericMergeSeriesSet returns a new genericSeriesSet that merges (and deduplicates)
// series returned by the series sets when iterating.
// Each series set must return its series in labels order, otherwise
// merged series set will be incorrect.
// Overlapped situations are merged using provided mergeFunc.
func newGenericMergeSeriesSet(sets []genericSeriesSet, mergeFunc genericSeriesMergeFunc) genericSeriesSet {
	if len(sets) == 1 {
		return sets[0]
	}

	// We are pre-advancing sets, so we can introspect the label of the
	// series under the cursor.
	var h genericSeriesSetHeap
	for _, set := range sets {
		if set == nil {
			continue
		}
		if set.Next() {
			heap.Push(&h, set)
		}
		if err := set.Err(); err != nil {
			return errorOnlySeriesSet{err}
		}
	}
	return &genericMergeSeriesSet{
		mergeFunc: mergeFunc,
		sets:      sets,
		heap:      h,
	}
}- 看代码中有遍历往 heap中push的动作,应该是为了去重deduplicates
- 看上面的注释说,主要为了merges (and deduplicates)
用到的merge func是这个
- D:\go_path\pkg\mod\github.com\prometheus\prometheus@v1.8.2-0.20210321183757-31a518faab18\storage\merge.go
// ChainedSeriesMerge returns single series from many same, potentially overlapping series by chaining samples together.
// If one or more samples overlap, one sample from random overlapped ones is kept and all others with the same
// timestamp are dropped.
//
// This works the best with replicated series, where data from two series are exactly the same. This does not work well
// with "almost" the same data, e.g. from 2 Prometheus HA replicas. This is fine, since from the Prometheus perspective
// this never happens.
//
// It's optimized for non-overlap cases as well.
func ChainedSeriesMerge(series ...Series) Series {
	if len(series) == 0 {
		return nil
	}
	return &SeriesEntry{
		Lset: series[0].Labels(),
		SampleIteratorFn: func() chunkenc.Iterator {
			iterators := make([]chunkenc.Iterator, 0, len(series))
			for _, s := range series {
				iterators = append(iterators, s.Iterator())
			}
			return newChainSampleIterator(iterators)
		},
	}
}- 看起来还要再遍历一次
remote_read不应该查询过多数据
- 在官方文档上进行了说明
- 查询 10,000 系列并不是一个好主意,即使对于 Prometheus 原生 HTTPquery_range端点也是如此
- 因为您的浏览器根本不会高兴地获取、存储和呈现数百兆字节的数据
- 此外,出于仪表板和渲染目的,拥有那么多数据是不切实际的,因为人类不可能读取它。这就是为什么我们通常会制作不超过 20 个系列的查询。
- 这很好,但一种非常常见的技术是以查询返回聚合20 个系列的方式组合查询,
本节重点总结 :
- 现象 remote_read查询series比直接查询要慢很多
- remote_read源码解析
- remote_read代码中有遍历往 heap中push的动作,是为了去重deduplicates
- 内层调用又会遍历Sample导致速度比较慢
- 无论是何种查询,都应该避免过多series,应该多使用聚合
33.5 remote实战项目之设计prometheus数据源的结构
本节重点介绍 :
- 项目要求
- 通过remote read读取prometheus中的数据
- 通过remote write向prometheus中写入数据
- 准备工作
- 新建项目 prome_remote_read_write
- 设计prometheus 数据源的结构
- 初始化
项目要求
- 通过remote read读取prometheus中的数据
- 通过remote write向prometheus中写入数据
准备工作
新建项目 prome_remote_read_write
go mod init prome_remote_read_write准备配置文件 prome_remote_read_write.yml
- remoteWrite代表 支持remote_write的多个后端
- remoteRead代表 支持remote_read的多个后端
remoteWrite:
  # m3db的配置
  #- name: m3db01
  #  url: http://localhost:7201/api/v1/prom/remote/write
  #  remoteTimeoutSecond: 5

  # prometheus的配置
  - name: prome01
    url: http://172.20.70.205:9090/api/v1/write
    remoteTimeoutSecond: 5
remoteRead:
  - name: prome01
    url: http://172.20.70.205:9090/api/v1/read
    remoteTimeoutSecond: 5
配置文件解析
- config/config.go
package config

import (
	"github.com/toolkits/pkg/logger"
	"gopkg.in/yaml.v2"
	"io/ioutil"
)

type RemoteConfig struct {
	Name                string `yaml:"name"`
	Url                 string `yaml:"url"`
	RemoteTimeoutSecond int    `yaml:"remoteTimeoutSecond"`
}

type PromeSection struct {
	RemoteWrite []RemoteConfig `yaml:"remoteWrite"`
	RemoteRead  []RemoteConfig `yaml:"remoteRead"`
}

func Load(s string) (*PromeSection, error) {
	cfg := &PromeSection{}

	err := yaml.Unmarshal([]byte(s), cfg)

	if err != nil {
		return nil, err
	}
	return cfg, nil
}

func LoadFile(filename string) (*PromeSection, error) {
	content, err := ioutil.ReadFile(filename)
	if err != nil {
		return nil, err
	}

	cfg, err := Load(string(content))
	if err != nil {
		logger.Errorf("[parsing YAML file errr...][error:%v]", err)
		return nil, err
	}
	return cfg, nil
}
main.go中解析配置
package main

import (
	"flag"
	"github.com/toolkits/pkg/logger"
	"math/rand"
	"prome_remote_read_write/config"
	"prome_remote_read_write/datasource"
	"time"
)

func main() {
	rand.Seed(time.Now().UnixNano())
	configFile := flag.String("config", "prome_remote_read_write.yml",
		"Address on which to expose metrics and web interface.")
	flag.Parse()

	sConfig, err := config.LoadFile(*configFile)
	if err != nil {
		logger.Infof("config.LoadFile Error,Exiting ...error:%v", err)
		return
	}
}
设计prometheus 数据源的结构
- 位置 datasource/prome.go
package datasource

import (
	"github.com/go-kit/kit/log"
	"github.com/prometheus/client_golang/prometheus"
	config_util "github.com/prometheus/common/config"
	"github.com/prometheus/common/model"
	"github.com/prometheus/common/promlog"
	pc "github.com/prometheus/prometheus/config"
	"github.com/prometheus/prometheus/prompb"
	"github.com/prometheus/prometheus/promql"
	"github.com/prometheus/prometheus/storage"
	"github.com/prometheus/prometheus/storage/remote"
	"github.com/toolkits/pkg/logger"
	"go.uber.org/atomic"
	"io/ioutil"
	"net/http"
	"net/url"
	"prome_remote_read_write/config"
	"time"
)

type PromeDataSource struct {
	Section      *config.PromeSection            //配置
	PushQueue    chan []prompb.TimeSeries        // 数据推送的chan
	LocalTmpDir  string                          // 本地临时目录,存放queries.active文件
	Queryable    storage.SampleAndChunkQueryable // 除了promql的查询,需要后端存储,如查询series
	QueryEngine  *promql.Engine                  // promql相关查询
	WriteTargets []*HttpClient                   // remote_write写入的后端地址
}

type HttpClient struct {
	remoteName string // Used to differentiate clients in metrics.
	url        *url.URL
	Client     *http.Client
	timeout    time.Duration
}
new函数
- 根据传入的配置new
func NewPromeDataSource(cg *config.PromeSection) *PromeDataSource {
	pd := &PromeDataSource{
		Section:   cg,
		PushQueue: make(chan []prompb.TimeSeries, 10000),
	}
	return pd
}
Init初始化函数
- 完整代码如下
type safePromQLNoStepSubqueryInterval struct {
	value atomic.Int64
}

func durationToInt64Millis(d time.Duration) int64 {
	return int64(d / time.Millisecond)
}
func (i *safePromQLNoStepSubqueryInterval) Set(ev model.Duration) {
	i.value.Store(durationToInt64Millis(time.Duration(ev)))
}
func (i *safePromQLNoStepSubqueryInterval) Get(int64) int64 {
	return i.value.Load()
}

func NewPromeDataSource(cg *config.PromeSection) *PromeDataSource {
	pd := &PromeDataSource{
		Section:   cg,
		PushQueue: make(chan []prompb.TimeSeries, 10000),
	}
	return pd
}

func (pd *PromeDataSource) Init() {
	// 模拟创建本地存储目录
	dbDir, err := ioutil.TempDir("", "tsdb-api-ready")
	if err != nil {
		logger.Errorf("[error_create_local_tsdb_dir][err: %v]", err)
		return
	}
	pd.LocalTmpDir = dbDir
	promlogConfig := promlog.Config{}
	// 使用本地目录创建remote-storage
	remoteS := remote.NewStorage(promlog.New(&promlogConfig), prometheus.DefaultRegisterer, func() (int64, error) {
		return 0, nil
	}, dbDir, 1*time.Minute, nil)

	// ApplyConfig 加载queryables
	remoteReadC := make([]*pc.RemoteReadConfig, 0)
	for _, u := range pd.Section.RemoteRead {

		ur, err := url.Parse(u.Url)
		if err != nil {
			logger.Errorf("[prome_ds_init_error][parse_url_error][url:%+v][err:%+v]", u.Url, err)
			continue
		}

		remoteReadC = append(remoteReadC,
			&pc.RemoteReadConfig{
				URL:           &config_util.URL{URL: ur},
				RemoteTimeout: model.Duration(time.Duration(u.RemoteTimeoutSecond) * time.Second),
				ReadRecent:    true,
			},
		)
	}
	if len(remoteReadC) == 0 {
		logger.Errorf("[prome_ds_error_got_zero_remote_read_storage]")
		return
	}
	err = remoteS.ApplyConfig(&pc.Config{RemoteReadConfigs: remoteReadC})
	if err != nil {
		logger.Errorf("[error_load_remote_read_config][err: %v]", err)
		return
	}
	pLogger := log.NewNopLogger()

	noStepSubqueryInterval := &safePromQLNoStepSubqueryInterval{}

	queryQueueDir, err := ioutil.TempDir(dbDir, "prom_query_concurrency")
	opts := promql.EngineOpts{
		Logger:                   log.With(pLogger, "component", "query engine"),
		Reg:                      prometheus.DefaultRegisterer,
		MaxSamples:               50000000,
		Timeout:                  30 * time.Second,
		ActiveQueryTracker:       promql.NewActiveQueryTracker(queryQueueDir, 20, log.With(pLogger, "component", "activeQueryTracker")),
		LookbackDelta:            5 * time.Minute,
		NoStepSubqueryIntervalFn: noStepSubqueryInterval.Get,
		EnableAtModifier:         true,
	}

	queryEngine := promql.NewEngine(opts)
	pd.QueryEngine = queryEngine
	pd.Queryable = remoteS

	// 初始化writeClients
	if len(pd.Section.RemoteWrite) == 0 {
		logger.Warningf("[prome_ds_init_with_zero_RemoteWrite_target]")
		logger.Infof("[successfully_init_prometheus_datasource][remote_read_num:%+v][remote_write_num:%+v]",
			len(pd.Section.RemoteRead),
			len(pd.Section.RemoteWrite),
		)
		return
	}
	writeTs := make([]*HttpClient, 0)
	for _, u := range pd.Section.RemoteWrite {
		ur, err := url.Parse(u.Url)
		if err != nil {
			logger.Errorf("[prome_ds_init_error][parse_url_error][url:%+v][err:%+v]", u.Url, err)
			continue
		}
		writeTs = append(writeTs,
			&HttpClient{
				remoteName: u.Name,
				url:        ur,
				Client:     &http.Client{},
				timeout:    time.Duration(u.RemoteTimeoutSecond) * time.Second,
			})
	}
	pd.WriteTargets = writeTs
	// 开启prometheus 队列消费协程
	go pd.remoteWrite()
	logger.Infof("[successfully_init_prometheus_datasource][remote_read_num:%+v][remote_write_num:%+v]",
		len(remoteReadC),
		len(writeTs),
	)
}
创建本地存储目录和remote-storage
- 模拟创建本地存储目录
	// 模拟创建本地存储目录
	dbDir, err := ioutil.TempDir("", "tsdb-api-ready")
	if err != nil {
		logger.Errorf("[error_create_local_tsdb_dir][err: %v]", err)
		return
	}
pd.LocalTmpDir = dbDir- 使用本地目录创建remote-storage
	// 使用本地目录创建remote-storage
	remoteS := remote.NewStorage(promlog.New(&promlogConfig), prometheus.DefaultRegisterer, func() (int64, error) {
		return 0, nil
	}, dbDir, 1*time.Minute, nil)
创建remote_read对象
- 遍历配置中的remote_read,构造RemoteReadConfig
- 使用RemoteReadConfig.ApplyConfig 生效配置
	// ApplyConfig 加载queryables
	remoteReadC := make([]*pc.RemoteReadConfig, 0)
	for _, u := range pd.Section.RemoteRead {

		ur, err := url.Parse(u.Url)
		if err != nil {
			logger.Errorf("[prome_ds_init_error][parse_url_error][url:%+v][err:%+v]", u.Url, err)
			continue
		}

		remoteReadC = append(remoteReadC,
			&pc.RemoteReadConfig{
				URL:           &config_util.URL{URL: ur},
				RemoteTimeout: model.Duration(time.Duration(u.RemoteTimeoutSecond) * time.Second),
				ReadRecent:    true,
			},
		)
	}
	if len(remoteReadC) == 0 {
		logger.Errorf("[prome_ds_error_got_zero_remote_read_storage]")
		return
	}
	err = remoteS.ApplyConfig(&pc.Config{RemoteReadConfigs: remoteReadC})
	if err != nil {
		logger.Errorf("[error_load_remote_read_config][err: %v]", err)
		return
	}
创建QueryEngine并赋值
	noStepSubqueryInterval := &safePromQLNoStepSubqueryInterval{}

	queryQueueDir, err := ioutil.TempDir(dbDir, "prom_query_concurrency")
	opts := promql.EngineOpts{
		Logger:                   log.With(pLogger, "component", "query engine"),
		Reg:                      prometheus.DefaultRegisterer,
		MaxSamples:               50000000,
		Timeout:                  30 * time.Second,
		ActiveQueryTracker:       promql.NewActiveQueryTracker(queryQueueDir, 20, log.With(pLogger, "component", "activeQueryTracker")),
		LookbackDelta:            5 * time.Minute,
		NoStepSubqueryIntervalFn: noStepSubqueryInterval.Get,
		EnableAtModifier:         true,
	}

	queryEngine := promql.NewEngine(opts)
	pd.QueryEngine = queryEngine
	pd.Queryable = remoteS
初始化writeClients创建RemoteWrite对象
- 遍历RemoteWrite配置创建
- 开启prometheus 队列消费协程
	// 初始化writeClients
	if len(pd.Section.RemoteWrite) == 0 {
		logger.Warningf("[prome_ds_init_with_zero_RemoteWrite_target]")
		logger.Infof("[successfully_init_prometheus_datasource][remote_read_num:%+v][remote_write_num:%+v]",
			len(pd.Section.RemoteRead),
			len(pd.Section.RemoteWrite),
		)
		return
	}
	writeTs := make([]*HttpClient, 0)
	for _, u := range pd.Section.RemoteWrite {
		ur, err := url.Parse(u.Url)
		if err != nil {
			logger.Errorf("[prome_ds_init_error][parse_url_error][url:%+v][err:%+v]", u.Url, err)
			continue
		}
		writeTs = append(writeTs,
			&HttpClient{
				remoteName: u.Name,
				url:        ur,
				Client:     &http.Client{},
				timeout:    time.Duration(u.RemoteTimeoutSecond) * time.Second,
			})
	}
	pd.WriteTargets = writeTs
	// 开启prometheus 队列消费协程
	go pd.remoteWrite()
	logger.Infof("[successfully_init_prometheus_datasource][remote_read_num:%+v][remote_write_num:%+v]",
		len(remoteReadC),
		len(writeTs),
	)
本节重点总结 :
- 项目要求
- 通过remote read读取prometheus中的数据
- 通过remote write向prometheus中写入数据
- 准备工作
- 新建项目 prome_remote_read_write
- 设计prometheus 数据源的结构
- 初始化
33.6 read的代码,查询series方法和QueryEngine的RangeQuery方法
本节重点介绍 :
- remote_read代码需求
- 查询一个标签的值列表
- 查询一段时间的数据
- 通用的查询series方法
- 查询一个标签的值列表
- 查询一段时间的数据
remote_read代码需求
- 查询一个标签的值列表
- 查询一段时间的数据
通用的查询series方法
- 补全go.mod
module prome_remote_read_write go 1.16 require ( github.com/go-kit/kit v0.10.0 github.com/gogo/protobuf v1.3.2 github.com/golang/snappy v0.0.2 github.com/opentracing-contrib/go-stdlib v1.0.0 github.com/opentracing/opentracing-go v1.2.0 github.com/pkg/errors v0.9.1 github.com/prometheus/client_golang v1.9.0 github.com/prometheus/common v0.17.0 github.com/prometheus/prometheus v1.8.2-0.20210220213500-8c8de46003d1 github.com/toolkits/pkg v1.1.8 go.uber.org/atomic v1.7.0 gopkg.in/yaml.v2 v2.4.0 )- 位置 datasource\read.go
package datasource

import (
	"context"
	"errors"
	"github.com/prometheus/prometheus/pkg/labels"
	"github.com/prometheus/prometheus/promql"
	"github.com/prometheus/prometheus/promql/parser"
	"github.com/prometheus/prometheus/storage"
	"github.com/toolkits/pkg/logger"
	"math"
	"sort"
	"time"
)

func (pd *PromeDataSource) CommonQuerySeries(qlStrFinal string) storage.SeriesSet {

	matcherSets, err := parseMatchersParam([]string{qlStrFinal})
	if err != nil {
		logger.Errorf("[prome_query_error][parse_label_match_error][err:%+v]", err)
		return nil
	}
	tEnd := time.Now().Unix()
	tStart := tEnd - 60*5

	startT := millisecondTs(timeParse(tStart))
	endT := millisecondTs(timeParse(tEnd))

	ctx, _ := context.WithTimeout(context.Background(), time.Second*30)
	q, err := pd.Queryable.Querier(ctx, startT, endT)
	if err != nil {

		logger.Errorf("[prome_query_error][get_querier_errro]")
		return nil
	}

	defer q.Close()

	hints := &storage.SelectHints{
		Start: startT,
		End:   endT,
		Func:  "series", // There is no series function, this token is used for lookups that don't need samples.
	}

	// Get all series which match matchers.
	s := q.Select(true, hints, matcherSets[0]...)

	return s

}
从promql中抽取标签matcher 得到 matcherSets
// 从promql中抽取标签matcher的函数
func parseMatchersParam(matchers []string) ([][]*labels.Matcher, error) {
	var matcherSets [][]*labels.Matcher
	for _, s := range matchers {
		matchers, err := parser.ParseMetricSelector(s)
		if err != nil {
			return nil, err
		}
		matcherSets = append(matcherSets, matchers)
	}

OUTER:
	for _, ms := range matcherSets {
		for _, lm := range ms {
			if lm != nil && !lm.Matches("") {
				continue OUTER
			}
		}
		return nil, errors.New("match[] must contain at least one non-empty matcher")
	}
	return matcherSets, nil
}
设置起始时间并转换为utc的毫秒时间戳
// 毫秒时间戳函数
func millisecondTs(t time.Time) int64 {
	return t.Unix()*1000 + int64(t.Nanosecond())/int64(time.Millisecond)
}

// 转行为utc时间
func timeParse(ts int64) time.Time {
	t := float64(ts)
	s, ns := math.Modf(t)
	ns = math.Round(ns*1000) / 1000
	return time.Unix(int64(s), int64(ns*float64(time.Second))).UTC()
}
创建查询对象,查询即可
	ctx, _ := context.WithTimeout(context.Background(), time.Second*30)
	q, err := pd.Queryable.Querier(ctx, startT, endT)
	if err != nil {

		logger.Errorf("[prome_query_error][get_querier_errro]")
		return nil
	}

	defer q.Close()

	hints := &storage.SelectHints{
		Start: startT,
		End:   endT,
		Func:  "series", // There is no series function, this token is used for lookups that don't need samples.
	}

	// Get all series which match matchers.
	s := q.Select(true, hints, matcherSets[0]...)
查询一个标签的值列表
- 相当于查询prometheus的原始接口

- 对应prometheus 中的 /api/v1/label/<label_name>/values
// 查询一个标签的值列表
// 对应prometheus 中的 /api/v1/label/<label_name>/values
func (pd *PromeDataSource) QueryLabelValue(promql string, targetLabel string) []string {
	s := pd.CommonQuerySeries(promql)
	if s.Warnings() != nil {
		logger.Warningf("[prome_query_error][series_set_iter_error][warning:%+v]", s.Warnings())

	}

	if err := s.Err(); err != nil {
		logger.Errorf("[prome_query_error][series_set_iter_error][err:%+v]", err)
		return nil
	}

	var sets []storage.SeriesSet
	sets = append(sets, s)
	set := storage.NewMergeSeriesSet(sets, storage.ChainedSeriesMerge)
	labelValuesSet := make(map[string]struct{})
	thisSeriesNum := 0
	for set.Next() {
		series := set.At()
		thisSeriesNum++
		for _, lb := range series.Labels() {
			if lb.Name == targetLabel {
				labelValuesSet[lb.Value] = struct{}{}
			}
		}
	}
	vals := make([]string, len(labelValuesSet))
	i := 0
	for val := range labelValuesSet {
		vals[i] = val
		i++
	}

	sort.Strings(vals)
	logger.Infof("[QueryLabelValue][promql:%v][targetLabel:%v][values:%v]", promql, targetLabel, vals)
	return vals
}
根据传入的promql查询得到series
	s := pd.CommonQuerySeries(promql)
	if s.Warnings() != nil {
		logger.Warningf("[prome_query_error][series_set_iter_error][warning:%+v]", s.Warnings())

	}

	if err := s.Err(); err != nil {
		logger.Errorf("[prome_query_error][series_set_iter_error][err:%+v]", err)
		return nil
	}
遍历series.Labels 根据lb.Name判断即可
	for set.Next() {
		series := set.At()
		thisSeriesNum++
		for _, lb := range series.Labels() {
			if lb.Name == targetLabel {
				labelValuesSet[lb.Value] = struct{}{}
			}
		}
	}
	vals := make([]string, len(labelValuesSet))
	i := 0
	for val := range labelValuesSet {
		vals[i] = val
		i++
	}

	sort.Strings(vals)
查询一段时间的数据
func tsToUtcTs(s int64) time.Time {
	return time.Unix(s, 0).UTC()
}

// 查询数据
func (pd *PromeDataSource) QueryData(qlStrFinal string) {

	tEnd := time.Now().Unix()
	tStart := tEnd - 60*5

	startT := tsToUtcTs(tStart)
	endT := tsToUtcTs(tEnd)

	resolution := time.Second * 15

	q, err := pd.QueryEngine.NewRangeQuery(pd.Queryable, qlStrFinal, startT, endT, resolution)
	if err != nil {
		logger.Errorf("[prome_query_error][QueryData_error_may_be_parse_ql_error][args:%+v][err:%+v]", qlStrFinal, err)
		return
	}
	ctx, _ := context.WithTimeout(context.Background(), time.Second*30)
	res := q.Exec(ctx)
	if res.Err != nil {
		logger.Errorf("[prome_query_error][rangeQuery_exec_error][args:%+v][err:%+v]", qlStrFinal, res.Err)
		q.Close()
		return
	}
	mat, ok := res.Value.(promql.Matrix)
	if !ok {
		logger.Errorf("[promql.Engine.exec: invalid expression type %q]", res.Value.Type())
		q.Close()
		return
	}
	if res.Err != nil {
		logger.Errorf("[prome_query_error][res.Matrix_error][args:%+v][err:%+v]", qlStrFinal, res.Err)
		q.Close()
		return
	}
	for _, m := range mat {
		logger.Infof("[vector_res:%v]", m.Metric.String())
		for _, p := range m.Points {

			ts := time.Unix(p.T/1e3, 0).Format("2006-01-02 15:04:05")
			logger.Infof("[detail][ts:%v][value:%v]", ts, p.V)
		}

	}
	q.Close()

	return
}
时间转换为utc时间
	tEnd := time.Now().Unix()
	tStart := tEnd - 60*5

	startT := tsToUtcTs(tStart)
	endT := tsToUtcTs(tEnd)

	resolution := time.Second * 15
使用QueryEngine创建RangeQuery对象
	q, err := pd.QueryEngine.NewRangeQuery(pd.Queryable, qlStrFinal, startT, endT, resolution)
	if err != nil {
		logger.Errorf("[prome_query_error][QueryData_error_may_be_parse_ql_error][args:%+v][err:%+v]", qlStrFinal, err)
		return
	}
执行查询解析结果为matrix
res := q.Exec(ctx)
	if res.Err != nil {
		logger.Errorf("[prome_query_error][rangeQuery_exec_error][args:%+v][err:%+v]", qlStrFinal, res.Err)
		q.Close()
		return
	}
	mat, ok := res.Value.(promql.Matrix)
	if !ok {
		logger.Errorf("[promql.Engine.exec: invalid expression type %q]", res.Value.Type())
		q.Close()
		return
	}
	if res.Err != nil {
		logger.Errorf("[prome_query_error][res.Matrix_error][args:%+v][err:%+v]", qlStrFinal, res.Err)
		q.Close()
		return
	}
遍历结果打印即可
	for _, m := range mat {
		logger.Infof("[vector_res:%v]", m.Metric.String())
		for _, p := range m.Points {

			ts := time.Unix(p.T/1e3, 0).Format("2006-01-02 15:04:05")
			logger.Infof("[detail][ts:%v][value:%v]", ts, p.V)
		}

	}
	q.Close()
运行查询
- main.go
- 查询标签名为__name__的结果列表,也就是所有metrics的name
- 查询任意一个promeql的数据 avg(rate(node_cpu_seconds_total{mode="system"}[1m])) by (instance) *100
package main

import (
	"flag"
	"github.com/toolkits/pkg/logger"
	"math/rand"
	"prome_remote_read_write/config"
	"prome_remote_read_write/datasource"
	"time"
)

func main() {
	rand.Seed(time.Now().UnixNano())
	configFile := flag.String("config", "prome_remote_read_write.yml",
		"Address on which to expose metrics and web interface.")
	flag.Parse()

	sConfig, err := config.LoadFile(*configFile)
	if err != nil {
		logger.Infof("config.LoadFile Error,Exiting ...error:%v", err)
		return
	}

	pd := datasource.NewPromeDataSource(sConfig)
	pd.Init()
    // 查询标签名为__name__的结果列表,也就是所有metrics的name
	res := pd.QueryLabelValue(`{__name__=~".*a.*"}`, "__name__")
	fmt.Println(res)

	// 查询数据
	pd.QueryData(`avg(rate(node_cpu_seconds_total{mode="system"}[1m])) by (instance) *100`)
}
metricsName查询结果
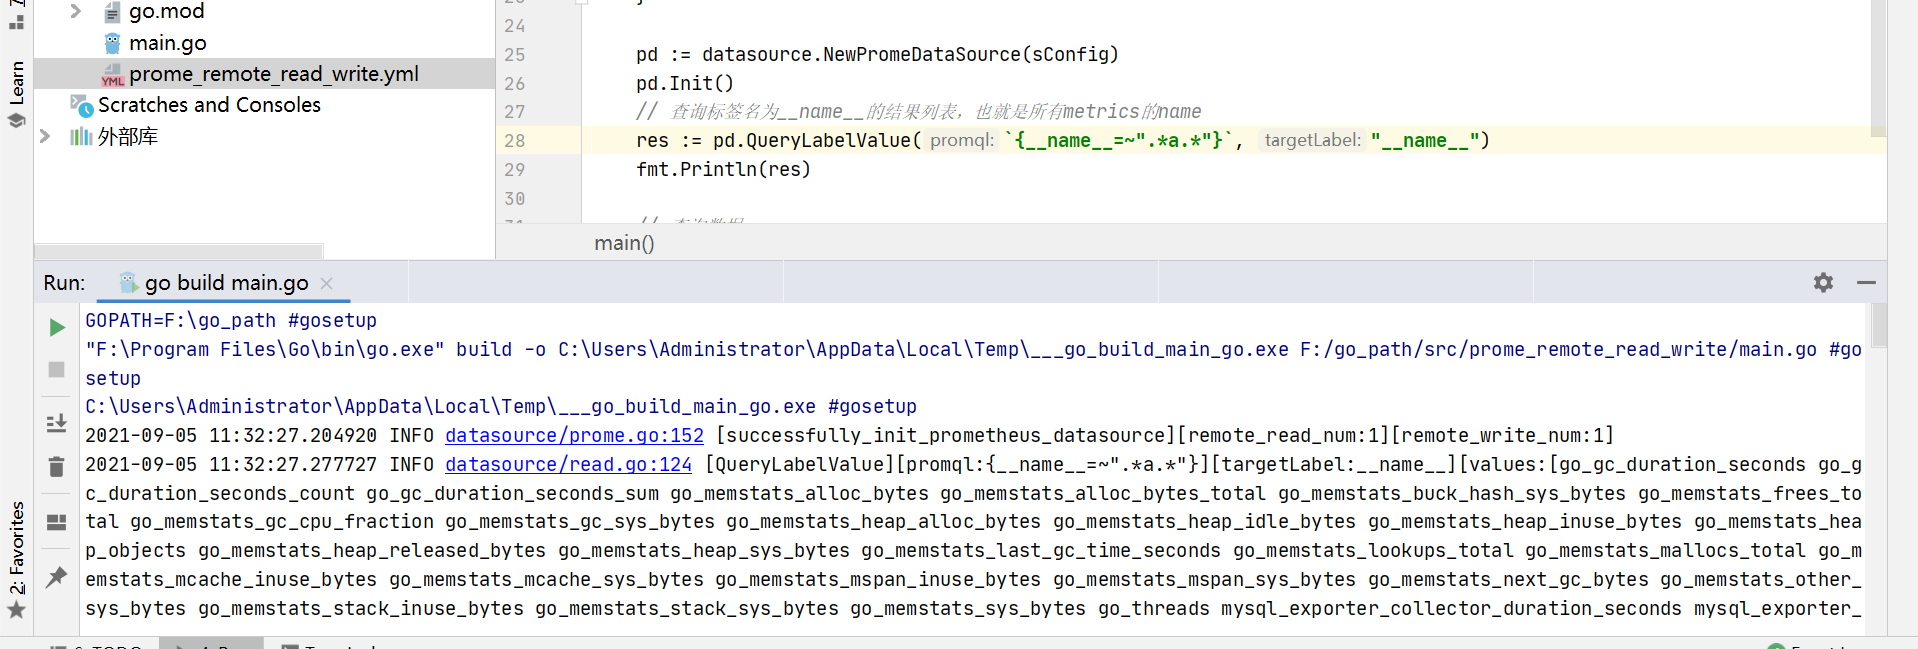
2021-08-31 15:44:26.128480 INFO datasource/prome.go:149 [successfully_init_prometheus_datasource][remote_read_num:1][remote_write_num:1]
2021-08-31 15:44:26.249858 INFO datasource/read.go:124 [QueryLabelValue][promql:{__name__=~".*a.*"}][targetLabel:__name__][values:[elasticsearch_cluster_health_json_parse_failures e
lasticsearch_cluster_health_total_scrapes elasticsearch_cluster_health_up elasticsearch_clusterinfo_last_retrieval_failure_ts elasticsearch_clusterinfo_up elasticsearch_exporter_bui
ld_info elasticsearch_node_stats_json_parse_failures elasticsearch_node_stats_total_scrapes elasticsearch_node_stats_up go_gc_duration_seconds go_gc_duration_seconds_count go_gc_dur
ation_seconds_sum go_memstats_alloc_bytes go_memstats_alloc_bytes_total go_memstats_buck_hash_sys_bytes go_memstats_frees_total go_memstats_gc_cpu_fraction go_memstats_gc_sys_bytes
go_memstats_heap_alloc_bytes go_memstats_heap_idle_bytes go_memstats_heap_inuse_bytes go_memstats_heap_objects go_memstats_heap_released_bytes go_memstats_heap_sys_bytes go_memstats
_last_gc_time_seconds go_memstats_lookups_total go_memstats_mallocs_total go_memstats_mcache_inuse_bytes go_memstats_mcache_sys_bytes go_memstats_mspan_inuse_bytes go_memstats_mspan
_sys_bytes go_memstats_next_gc_bytes go_memstats_other_sys_bytes go_memstats_stack_inuse_bytes go_memstats_stack_sys_bytes go_memstats_sys_bytes go_threads jmx_config_reload_failure
_created jmx_config_reload_failure_total jmx_config_reload_success_created jmx_config_reload_success_total jmx_scrape_cached_beans jmx_scrape_duration_seconds jmx_scrape_error jvm_b
uffer_pool_capacity_bytes jvm_classes_loaded jvm_classes_loaded_total jvm_classes_unloaded_total jvm_memory_bytes_max jvm_memory_objects_pending_finalization jvm_memory_pool_allocat
ed_bytes_created jvm_memory_pool_allocated_bytes_total jvm_memory_pool_bytes_max jvm_memory_pool_collection_max_bytes jvm_threads_current jvm_threads_daemon jvm_threads_deadlocked j
vm_threads_deadlocked_monitor jvm_threads_peak jvm_threads_started_total jvm_threads_state net_conntrack_dialer_conn_attempted_total net_conntrack_dialer_conn_closed_total net_connt
rack_dialer_conn_established_total net_conntrack_dialer_conn_failed_total net_conntrack_listener_conn_accepted_total net_conntrack_listener_conn_closed_total node_arp_entries node_c
ontext_switches_total node_cooling_device_cur_state node_cooling_device_max_state node_cpu_guest_seconds_total node_cpu_seconds_total node_disk_io_time_seconds_total node_disk_io_ti
me_weighted_seconds_total node_disk_read_bytes_total node_disk_read_time_seconds_total node_disk_reads_completed_total node_disk_reads_merged_total node_disk_write_time_seconds_tota
l node_disk_writes_completed_total node_disk_writes_merged_total node_disk_written_bytes_total node_entropy_available_bits node_filefd_allocated node_filefd_maximum node_filesystem_
avail_bytes node_filesystem_readonly node_forks_total node_intr_total node_ipvs_connections_total node_ipvs_incoming_bytes_total node_ipvs_incoming_packets_total node_ipvs_outgoing_
bytes_total node_ipvs_outgoing_packets_total node_load1 node_load15 node_load5 node_memory_Active_anon_bytes node_memory_AnonHugePages_bytes node_memory_AnonPages_bytes node_memory_
Cached_bytes node_memory_CmaFree_bytes node_memory_CmaTotal_bytes node_memory_DirectMap1G_bytes node_memory_DirectMap2M_bytes node_memory_DirectMap4k_bytes node_memory_HardwareCorru
pted_bytes node_memory_HugePages_Free node_memory_HugePages_Rsvd node_memory_HugePages_Surp node_memory_HugePages_Total node_memory_Hugepagesize_bytes node_memory_Inactive_anon_byte
s node_memory_Inactive_bytes node_memory_Inactive_file_bytes node_memory_KernelStack_bytes node_memory_Mapped_bytes node_memory_MemAvailable_bytes node_memory_MemTotal_bytes node_me
mory_NFS_Unstable_bytes node_memory_PageTables_bytes node_memory_SReclaimable_bytes node_memory_SUnreclaim_bytes node_memory_Slab_bytes node_memory_SwapCached_bytes node_memory_Swap
Free_bytes node_memory_SwapTotal_bytes node_memory_Unevictable_bytes node_memory_VmallocChunk_bytes node_memory_VmallocTotal_bytes node_memory_VmallocUsed_bytes node_memory_Writebac
kTmp_bytes node_memory_Writeback_bytes node_netstat_Icmp6_InErrors node_netstat_Icmp6_InMsgs node_netstat_Icmp6_OutMsgs node_netstat_Icmp_InErrors node_netstat_Icmp_InMsgs node_nets
tat_Icmp_OutMsgs node_netstat_Ip6_InOctets node_netstat_Ip6_OutOctets node_netstat_IpExt_InOctets node_netstat_IpExt_OutOctets node_netstat_Ip_Forwarding node_netstat_TcpExt_ListenD
rops node_netstat_TcpExt_ListenOverflows node_netstat_TcpExt_SyncookiesFailed node_netstat_TcpExt_SyncookiesRecv node_netstat_TcpExt_SyncookiesSent node_netstat_TcpExt_TCPSynRetrans
 node_netstat_Tcp_ActiveOpens node_netstat_Tcp_CurrEstab node_netstat_Tcp_InErrs node_netstat_Tcp_InSegs node_netstat_Tcp_OutRsts node_netstat_Tcp_OutSegs node_netstat_Tcp_PassiveOp
ens node_netstat_Tcp_RetransSegs node_netstat_Udp6_InDatagrams node_netstat_Udp6_InErrors node_netstat_Udp6_NoPorts node_netstat_Udp6_OutDatagrams node_netstat_Udp6_RcvbufErrors nod
e_netstat_Udp6_SndbufErrors node_netstat_UdpLite6_InErrors node_netstat_UdpLite_InErrors node_netstat_Udp_InDatagrams node_netstat_Udp_InErrors node_netstat_Udp_NoPorts node_netstat
_Udp_OutDatagrams node_netstat_Udp_RcvbufErrors node_netstat_Udp_SndbufErrors node_network_address_assign_type node_network_carrier node_network_carrier_changes_total node_network_d
ormant node_network_flags node_network_iface_id node_network_iface_link node_network_iface_link_mode node_network_receive_bytes_total node_network_receive_compressed_total node_netw
ork_receive_drop_total node_network_receive_errs_total node_network_receive_fifo_total node_network_receive_frame_total node_network_receive_multicast_total node_network_receive_pac
kets_total node_network_transmit_bytes_total node_network_transmit_carrier_total node_network_transmit_colls_total node_network_transmit_compressed_total node_network_transmit_drop_
total node_network_transmit_errs_total node_network_transmit_fifo_total node_network_transmit_packets_total node_network_transmit_queue_length node_nf_conntrack_entries node_nf_conn
track_entries_limit node_schedstat_running_seconds_total node_schedstat_timeslices_total node_schedstat_waiting_seconds_total node_scrape_collector_duration_seconds node_scrape_coll
ector_success node_sockstat_FRAG6_inuse node_sockstat_FRAG6_memory node_sockstat_FRAG_inuse node_sockstat_FRAG_memory node_sockstat_RAW6_inuse node_sockstat_RAW_inuse node_sockstat_
TCP6_inuse node_sockstat_TCP_alloc node_sockstat_TCP_inuse node_sockstat_TCP_mem node_sockstat_TCP_mem_bytes node_sockstat_TCP_orphan node_sockstat_TCP_tw node_sockstat_UDP6_inuse n
ode_sockstat_UDPLITE6_inuse node_sockstat_UDPLITE_inuse node_sockstat_UDP_inuse node_sockstat_UDP_mem node_sockstat_UDP_mem_bytes node_sockstat_sockets_used node_softnet_dropped_tot
al node_softnet_processed_total node_softnet_times_squeezed_total node_textfile_scrape_error node_timex_estimated_error_seconds node_timex_frequency_adjustment_ratio node_timex_loop
_time_constant node_timex_maxerror_seconds node_timex_pps_calibration_total node_timex_pps_error_total node_timex_pps_jitter_total node_timex_pps_stability_exceeded_total node_timex
_pps_stability_hertz node_timex_status node_timex_sync_status node_timex_tai_offset_seconds node_uname_info node_vmstat_pgfault node_vmstat_pgmajfault node_vmstat_pgpgin node_vmstat
_pgpgout node_vmstat_pswpin node_vmstat_pswpout node_xfs_allocation_btree_compares_total node_xfs_allocation_btree_lookups_total node_xfs_allocation_btree_records_deleted_total node
_xfs_allocation_btree_records_inserted_total node_xfs_block_map_btree_compares_total node_xfs_block_map_btree_lookups_total node_xfs_block_map_btree_records_deleted_total node_xfs_b
lock_map_btree_records_inserted_total node_xfs_block_mapping_extent_list_compares_total node_xfs_block_mapping_extent_list_deletions_total node_xfs_block_mapping_extent_list_inserti
ons_total node_xfs_block_mapping_extent_list_lookups_total node_xfs_block_mapping_reads_total node_xfs_block_mapping_unmaps_total node_xfs_block_mapping_writes_total node_xfs_direct
ory_operation_create_total node_xfs_directory_operation_getdents_total node_xfs_directory_operation_lookup_total node_xfs_directory_operation_remove_total node_xfs_extent_allocation
_blocks_allocated_total node_xfs_extent_allocation_blocks_freed_total node_xfs_extent_allocation_extents_allocated_total node_xfs_extent_allocation_extents_freed_total node_xfs_inod
e_operation_attempts_total node_xfs_inode_operation_attribute_changes_total node_xfs_inode_operation_duplicates_total node_xfs_inode_operation_found_total node_xfs_inode_operation_m
issed_total node_xfs_inode_operation_reclaims_total node_xfs_inode_operation_recycled_total node_xfs_read_calls_total node_xfs_vnode_active_total node_xfs_vnode_allocate_total node_
xfs_vnode_get_total node_xfs_vnode_hold_total node_xfs_vnode_reclaim_total node_xfs_vnode_release_total node_xfs_vnode_remove_total node_xfs_write_calls_total os_available_processor
s os_committed_virtual_memory_bytes os_cpu_load os_free_physical_memory_bytes os_free_swap_space_bytes os_max_file_descriptor_count os_process_cpu_load os_system_cpu_load os_system_
load_average os_total_memory_size os_total_physical_memory_bytes os_total_swap_space_bytes probe_duration_seconds probe_failed_due_to_regex probe_http_duration_seconds probe_http_st
atus_code probe_ip_addr_hash probe_ssl_earliest_cert_expiry probe_ssl_last_chain_expiry_timestamp_seconds probe_ssl_last_chain_info process_cpu_seconds_total process_max_fds process
_start_time_seconds process_virtual_memory_bytes process_virtual_memory_max_bytes prometheus_api_remote_read_queries prometheus_config_last_reload_success_timestamp_seconds promethe
us_config_last_reload_successful prometheus_engine_queries_concurrent_max prometheus_engine_query_duration_seconds prometheus_engine_query_duration_seconds_count prometheus_engine_q
uery_duration_seconds_sum prometheus_engine_query_log_enabled prometheus_engine_query_log_failures_total prometheus_http_request_duration_seconds_bucket prometheus_http_request_dura
tion_seconds_count prometheus_http_request_duration_seconds_sum prometheus_http_requests_total prometheus_notifications_alertmanagers_discovered prometheus_notifications_dropped_tot
al prometheus_notifications_errors_total prometheus_notifications_latency_seconds prometheus_notifications_latency_seconds_count prometheus_notifications_latency_seconds_sum prometh
eus_notifications_queue_capacity prometheus_notifications_queue_length prometheus_notifications_sent_total prometheus_remote_storage_exemplars_in_total prometheus_remote_storage_hig
hest_timestamp_in_seconds prometheus_remote_storage_samples_in_total prometheus_remote_storage_string_interner_zero_reference_releases_total prometheus_rule_evaluation_duration_seco
nds prometheus_rule_evaluation_duration_seconds_count prometheus_rule_evaluation_duration_seconds_sum prometheus_rule_evaluation_failures_total prometheus_rule_evaluations_total pro
metheus_rule_group_duration_seconds prometheus_rule_group_duration_seconds_count prometheus_rule_group_duration_seconds_sum prometheus_rule_group_interval_seconds prometheus_rule_gr
oup_iterations_missed_total prometheus_rule_group_iterations_total prometheus_rule_group_last_duration_seconds prometheus_rule_group_last_evaluation_samples prometheus_rule_group_la
st_evaluation_timestamp_seconds prometheus_sd_consul_rpc_duration_seconds prometheus_sd_consul_rpc_duration_seconds_count prometheus_sd_consul_rpc_duration_seconds_sum prometheus_sd
_consul_rpc_failures_total prometheus_sd_discovered_targets prometheus_sd_dns_lookup_failures_total prometheus_sd_dns_lookups_total prometheus_sd_failed_configs prometheus_sd_file_r
ead_errors_total prometheus_sd_file_scan_duration_seconds prometheus_sd_file_scan_duration_seconds_count prometheus_sd_file_scan_duration_seconds_sum prometheus_sd_kubernetes_events
_total prometheus_sd_received_updates_total prometheus_sd_updates_total prometheus_target_interval_length_seconds prometheus_target_interval_length_seconds_count prometheus_target_i
nterval_length_seconds_sum prometheus_target_metadata_cache_bytes prometheus_target_metadata_cache_entries prometheus_target_scrape_pool_exceeded_label_limits_total prometheus_targe
t_scrape_pool_exceeded_target_limit_total prometheus_target_scrape_pool_reloads_failed_total prometheus_target_scrape_pool_reloads_total prometheus_target_scrape_pool_sync_total pro
metheus_target_scrape_pool_targets prometheus_target_scrape_pools_failed_total prometheus_target_scrape_pools_total prometheus_target_scrapes_cache_flush_forced_total prometheus_tar
get_scrapes_exceeded_body_size_limit_total prometheus_target_scrapes_exceeded_sample_limit_total prometheus_target_scrapes_exemplar_out_of_order_total prometheus_target_scrapes_samp
le_duplicate_timestamp_total prometheus_target_scrapes_sample_out_of_bounds_total prometheus_target_scrapes_sample_out_of_order_total prometheus_target_sync_failed_total prometheus_
target_sync_length_seconds prometheus_target_sync_length_seconds_count prometheus_target_sync_length_seconds_sum prometheus_template_text_expansion_failures_total prometheus_templat
e_text_expansions_total prometheus_treecache_watcher_goroutines prometheus_treecache_zookeeper_failures_total prometheus_tsdb_blocks_loaded prometheus_tsdb_checkpoint_creations_fail
ed_total prometheus_tsdb_checkpoint_creations_total prometheus_tsdb_checkpoint_deletions_failed_total prometheus_tsdb_checkpoint_deletions_total prometheus_tsdb_clean_start promethe
us_tsdb_compaction_chunk_range_seconds_bucket prometheus_tsdb_compaction_chunk_range_seconds_count prometheus_tsdb_compaction_chunk_range_seconds_sum prometheus_tsdb_compaction_chun
k_samples_bucket prometheus_tsdb_compaction_chunk_samples_count prometheus_tsdb_compaction_chunk_samples_sum prometheus_tsdb_compaction_chunk_size_bytes_bucket prometheus_tsdb_compa
ction_chunk_size_bytes_count prometheus_tsdb_compaction_chunk_size_bytes_sum prometheus_tsdb_compaction_duration_seconds_bucket prometheus_tsdb_compaction_duration_seconds_count pro
metheus_tsdb_compaction_duration_seconds_sum prometheus_tsdb_compaction_populating_block prometheus_tsdb_compactions_failed_total prometheus_tsdb_compactions_skipped_total prometheu
s_tsdb_compactions_total prometheus_tsdb_compactions_triggered_total prometheus_tsdb_data_replay_duration_seconds prometheus_tsdb_head_active_appenders prometheus_tsdb_head_chunks p
rometheus_tsdb_head_chunks_created_total prometheus_tsdb_head_chunks_removed_total prometheus_tsdb_head_gc_duration_seconds_count prometheus_tsdb_head_gc_duration_seconds_sum promet
heus_tsdb_head_max_time prometheus_tsdb_head_max_time_seconds prometheus_tsdb_head_min_time prometheus_tsdb_head_min_time_seconds prometheus_tsdb_head_samples_appended_total prometh
eus_tsdb_head_series prometheus_tsdb_head_series_created_total prometheus_tsdb_head_series_not_found_total prometheus_tsdb_head_series_removed_total prometheus_tsdb_head_truncations
_failed_total prometheus_tsdb_head_truncations_total prometheus_tsdb_isolation_high_watermark prometheus_tsdb_isolation_low_watermark prometheus_tsdb_lowest_timestamp prometheus_tsd
b_lowest_timestamp_seconds prometheus_tsdb_mmap_chunk_corruptions_total prometheus_tsdb_out_of_bound_samples_total prometheus_tsdb_out_of_order_samples_total prometheus_tsdb_reloads
_failures_total prometheus_tsdb_reloads_total prometheus_tsdb_size_retentions_total prometheus_tsdb_storage_blocks_bytes prometheus_tsdb_symbol_table_size_bytes prometheus_tsdb_time
_retentions_total prometheus_tsdb_tombstone_cleanup_seconds_bucket prometheus_tsdb_tombstone_cleanup_seconds_count prometheus_tsdb_tombstone_cleanup_seconds_sum prometheus_tsdb_vert
ical_compactions_total prometheus_tsdb_wal_completed_pages_total prometheus_tsdb_wal_corruptions_total prometheus_tsdb_wal_fsync_duration_seconds prometheus_tsdb_wal_fsync_duration_
seconds_count prometheus_tsdb_wal_fsync_duration_seconds_sum prometheus_tsdb_wal_page_flushes_total prometheus_tsdb_wal_segment_current prometheus_tsdb_wal_truncate_duration_seconds
_count prometheus_tsdb_wal_truncate_duration_seconds_sum prometheus_tsdb_wal_truncations_failed_total prometheus_tsdb_wal_truncations_total prometheus_tsdb_wal_writes_failed_total p
rometheus_web_federation_errors_total prometheus_web_federation_warnings_total promhttp_metric_handler_errors_total promhttp_metric_handler_requests_in_flight promhttp_metric_handle
r_requests_total scrape_duration_seconds scrape_samples_post_metric_relabeling scrape_samples_scraped scrape_series_added zk_approximate_data_size zk_avg_latency zk_ephemerals_count
 zk_max_file_descriptor_count zk_max_latency zk_min_latency zk_num_alive_connections zk_outstanding_requests zk_packets_received zk_packets_sent zk_server_leader zk_watch_count]]
2021-08-31 15:44:26.252610 INFO prome_remote_read_write/main.go:27 [elasticsearch_cluster_health_json_parse_failures elasticsearch_cluster_health_total_scrapes elasticsearch_cluster
_health_up elasticsearch_clusterinfo_last_retrieval_failure_ts elasticsearch_clusterinfo_up elasticsearch_exporter_build_info elasticsearch_node_stats_json_parse_failures elasticsea
rch_node_stats_total_scrapes elasticsearch_node_stats_up go_gc_duration_seconds go_gc_duration_seconds_count go_gc_duration_seconds_sum go_memstats_alloc_bytes go_memstats_alloc_byt
es_total go_memstats_buck_hash_sys_bytes go_memstats_frees_total go_memstats_gc_cpu_fraction go_memstats_gc_sys_bytes go_memstats_heap_alloc_bytes go_memstats_heap_idle_bytes go_mem
stats_heap_inuse_bytes go_memstats_heap_objects go_memstats_heap_released_bytes go_memstats_heap_sys_bytes go_memstats_last_gc_time_seconds go_memstats_lookups_total go_memstats_mal
locs_total go_memstats_mcache_inuse_bytes go_memstats_mcache_sys_bytes go_memstats_mspan_inuse_bytes go_memstats_mspan_sys_bytes go_memstats_next_gc_bytes go_memstats_other_sys_byte
s go_memstats_stack_inuse_bytes go_memstats_stack_sys_bytes go_memstats_sys_bytes go_threads jmx_config_reload_failure_created jmx_config_reload_failure_total jmx_config_reload_succ
ess_created jmx_config_reload_success_total jmx_scrape_cached_beans jmx_scrape_duration_seconds jmx_scrape_error jvm_buffer_pool_capacity_bytes jvm_classes_loaded jvm_classes_loaded
_total jvm_classes_unloaded_total jvm_memory_bytes_max jvm_memory_objects_pending_finalization jvm_memory_pool_allocated_bytes_created jvm_memory_pool_allocated_bytes_total jvm_memo
ry_pool_bytes_max jvm_memory_pool_collection_max_bytes jvm_threads_current jvm_threads_daemon jvm_threads_deadlocked jvm_threads_deadlocked_monitor jvm_threads_peak jvm_threads_star
ted_total jvm_threads_state net_conntrack_dialer_conn_attempted_total net_conntrack_dialer_conn_closed_total net_conntrack_dialer_conn_established_total net_conntrack_dialer_conn_fa
iled_total net_conntrack_listener_conn_accepted_total net_conntrack_listener_conn_closed_total node_arp_entries node_context_switches_total node_cooling_device_cur_state node_coolin
g_device_max_state node_cpu_guest_seconds_total node_cpu_seconds_total node_disk_io_time_seconds_total node_disk_io_time_weighted_seconds_total node_disk_read_bytes_total node_disk_
read_time_seconds_total node_disk_reads_completed_total node_disk_reads_merged_total node_disk_write_time_seconds_total node_disk_writes_completed_total node_disk_writes_merged_tota
l node_disk_written_bytes_total node_entropy_available_bits node_filefd_allocated node_filefd_maximum node_filesystem_avail_bytes node_filesystem_readonly node_forks_total node_intr
_total node_ipvs_connections_total node_ipvs_incoming_bytes_total node_ipvs_incoming_packets_total node_ipvs_outgoing_bytes_total node_ipvs_outgoing_packets_total node_load1 node_lo
ad15 node_load5 node_memory_Active_anon_bytes node_memory_AnonHugePages_bytes node_memory_AnonPages_bytes node_memory_Cached_bytes node_memory_CmaFree_bytes node_memory_CmaTotal_byt
es node_memory_DirectMap1G_bytes node_memory_DirectMap2M_bytes node_memory_DirectMap4k_bytes node_memory_HardwareCorrupted_bytes node_memory_HugePages_Free node_memory_HugePages_Rsv
d node_memory_HugePages_Surp node_memory_HugePages_Total node_memory_Hugepagesize_bytes node_memory_Inactive_anon_bytes node_memory_Inactive_bytes node_memory_Inactive_file_bytes no
de_memory_KernelStack_bytes node_memory_Mapped_bytes node_memory_MemAvailable_bytes node_memory_MemTotal_bytes node_memory_NFS_Unstable_bytes node_memory_PageTables_bytes node_memor
y_SReclaimable_bytes node_memory_SUnreclaim_bytes node_memory_Slab_bytes node_memory_SwapCached_bytes node_memory_SwapFree_bytes node_memory_SwapTotal_bytes node_memory_Unevictable_
bytes node_memory_VmallocChunk_bytes node_memory_VmallocTotal_bytes node_memory_VmallocUsed_bytes node_memory_WritebackTmp_bytes node_memory_Writeback_bytes node_netstat_Icmp6_InErr
ors node_netstat_Icmp6_InMsgs node_netstat_Icmp6_OutMsgs node_netstat_Icmp_InErrors node_netstat_Icmp_InMsgs node_netstat_Icmp_OutMsgs node_netstat_Ip6_InOctets node_netstat_Ip6_Out
Octets node_netstat_IpExt_InOctets node_netstat_IpExt_OutOctets node_netstat_Ip_Forwarding node_netstat_TcpExt_ListenDrops node_netstat_TcpExt_ListenOverflows node_netstat_TcpExt_Sy
ncookiesFailed node_netstat_TcpExt_SyncookiesRecv node_netstat_TcpExt_SyncookiesSent node_netstat_TcpExt_TCPSynRetrans node_netstat_Tcp_ActiveOpens node_netstat_Tcp_CurrEstab node_n
etstat_Tcp_InErrs node_netstat_Tcp_InSegs node_netstat_Tcp_OutRsts node_netstat_Tcp_OutSegs node_netstat_Tcp_PassiveOpens node_netstat_Tcp_RetransSegs node_netstat_Udp6_InDatagrams
node_netstat_Udp6_InErrors node_netstat_Udp6_NoPorts node_netstat_Udp6_OutDatagrams node_netstat_Udp6_RcvbufErrors node_netstat_Udp6_SndbufErrors node_netstat_UdpLite6_InErrors node
_netstat_UdpLite_InErrors node_netstat_Udp_InDatagrams node_netstat_Udp_InErrors node_netstat_Udp_NoPorts node_netstat_Udp_OutDatagrams node_netstat_Udp_RcvbufErrors node_netstat_Ud
p_SndbufErrors node_network_address_assign_type node_network_carrier node_network_carrier_changes_total node_network_dormant node_network_flags node_network_iface_id node_network_if
ace_link node_network_iface_link_mode node_network_receive_bytes_total node_network_receive_compressed_total node_network_receive_drop_total node_network_receive_errs_total node_net
work_receive_fifo_total node_network_receive_frame_total node_network_receive_multicast_total node_network_receive_packets_total node_network_transmit_bytes_total node_network_trans
mit_carrier_total node_network_transmit_colls_total node_network_transmit_compressed_total node_network_transmit_drop_total node_network_transmit_errs_total node_network_transmit_fi
fo_total node_network_transmit_packets_total node_network_transmit_queue_length node_nf_conntrack_entries node_nf_conntrack_entries_limit node_schedstat_running_seconds_total node_s
chedstat_timeslices_total node_schedstat_waiting_seconds_total node_scrape_collector_duration_seconds node_scrape_collector_success node_sockstat_FRAG6_inuse node_sockstat_FRAG6_mem
ory node_sockstat_FRAG_inuse node_sockstat_FRAG_memory node_sockstat_RAW6_inuse node_sockstat_RAW_inuse node_sockstat_TCP6_inuse node_sockstat_TCP_alloc node_sockstat_TCP_inuse node
_sockstat_TCP_mem node_sockstat_TCP_mem_bytes node_sockstat_TCP_orphan node_sockstat_TCP_tw node_sockstat_UDP6_inuse node_sockstat_UDPLITE6_inuse node_sockstat_UDPLITE_inuse node_so
ckstat_UDP_inuse node_sockstat_UDP_mem node_sockstat_UDP_mem_bytes node_sockstat_sockets_used node_softnet_dropped_total node_softnet_processed_total node_softnet_times_squeezed_tot
al node_textfile_scrape_error node_timex_estimated_error_seconds node_timex_frequency_adjustment_ratio node_timex_loop_time_constant node_timex_maxerror_seconds node_timex_pps_calib
ration_total node_timex_pps_error_total node_timex_pps_jitter_total node_timex_pps_stability_exceeded_total node_timex_pps_stability_hertz node_timex_status node_timex_sync_status n
ode_timex_tai_offset_seconds node_uname_info node_vmstat_pgfault node_vmstat_pgmajfault node_vmstat_pgpgin node_vmstat_pgpgout node_vmstat_pswpin node_vmstat_pswpout node_xfs_alloca
tion_btree_compares_total node_xfs_allocation_btree_lookups_total node_xfs_allocation_btree_records_deleted_total node_xfs_allocation_btree_records_inserted_total node_xfs_block_map
_btree_compares_total node_xfs_block_map_btree_lookups_total node_xfs_block_map_btree_records_deleted_total node_xfs_block_map_btree_records_inserted_total node_xfs_block_mapping_ex
tent_list_compares_total node_xfs_block_mapping_extent_list_deletions_total node_xfs_block_mapping_extent_list_insertions_total node_xfs_block_mapping_extent_list_lookups_total node
_xfs_block_mapping_reads_total node_xfs_block_mapping_unmaps_total node_xfs_block_mapping_writes_total node_xfs_directory_operation_create_total node_xfs_directory_operation_getdent
s_total node_xfs_directory_operation_lookup_total node_xfs_directory_operation_remove_total node_xfs_extent_allocation_blocks_allocated_total node_xfs_extent_allocation_blocks_freed
_total node_xfs_extent_allocation_extents_allocated_total node_xfs_extent_allocation_extents_freed_total node_xfs_inode_operation_attempts_total node_xfs_inode_operation_attribute_c
hanges_total node_xfs_inode_operation_duplicates_total node_xfs_inode_operation_found_total node_xfs_inode_operation_missed_total node_xfs_inode_operation_reclaims_total node_xfs_in
ode_operation_recycled_total node_xfs_read_calls_total node_xfs_vnode_active_total node_xfs_vnode_allocate_total node_xfs_vnode_get_total node_xfs_vnode_hold_total node_xfs_vnode_re
claim_total node_xfs_vnode_release_total node_xfs_vnode_remove_total node_xfs_write_calls_total os_available_processors os_committed_virtual_memory_bytes os_cpu_load os_free_physica
l_memory_bytes os_free_swap_space_bytes os_max_file_descriptor_count os_process_cpu_load os_system_cpu_load os_system_load_average os_total_memory_size os_total_physical_memory_byte
s os_total_swap_space_bytes probe_duration_seconds probe_failed_due_to_regex probe_http_duration_seconds probe_http_status_code probe_ip_addr_hash probe_ssl_earliest_cert_expiry pro
be_ssl_last_chain_expiry_timestamp_seconds probe_ssl_last_chain_info process_cpu_seconds_total process_max_fds process_start_time_seconds process_virtual_memory_bytes process_virtua
l_memory_max_bytes prometheus_api_remote_read_queries prometheus_config_last_reload_success_timestamp_seconds prometheus_config_last_reload_successful prometheus_engine_queries_conc
urrent_max prometheus_engine_query_duration_seconds prometheus_engine_query_duration_seconds_count prometheus_engine_query_duration_seconds_sum prometheus_engine_query_log_enabled p
rometheus_engine_query_log_failures_total prometheus_http_request_duration_seconds_bucket prometheus_http_request_duration_seconds_count prometheus_http_request_duration_seconds_sum
 prometheus_http_requests_total prometheus_notifications_alertmanagers_discovered prometheus_notifications_dropped_total prometheus_notifications_errors_total prometheus_notificatio
ns_latency_seconds prometheus_notifications_latency_seconds_count prometheus_notifications_latency_seconds_sum prometheus_notifications_queue_capacity prometheus_notifications_queue
_length prometheus_notifications_sent_total prometheus_remote_storage_exemplars_in_total prometheus_remote_storage_highest_timestamp_in_seconds prometheus_remote_storage_samples_in_
total prometheus_remote_storage_string_interner_zero_reference_releases_total prometheus_rule_evaluation_duration_seconds prometheus_rule_evaluation_duration_seconds_count prometheu
s_rule_evaluation_duration_seconds_sum prometheus_rule_evaluation_failures_total prometheus_rule_evaluations_total prometheus_rule_group_duration_seconds prometheus_rule_group_durat
ion_seconds_count prometheus_rule_group_duration_seconds_sum prometheus_rule_group_interval_seconds prometheus_rule_group_iterations_missed_total prometheus_rule_group_iterations_to
tal prometheus_rule_group_last_duration_seconds prometheus_rule_group_last_evaluation_samples prometheus_rule_group_last_evaluation_timestamp_seconds prometheus_sd_consul_rpc_durati
on_seconds prometheus_sd_consul_rpc_duration_seconds_count prometheus_sd_consul_rpc_duration_seconds_sum prometheus_sd_consul_rpc_failures_total prometheus_sd_discovered_targets pro
metheus_sd_dns_lookup_failures_total prometheus_sd_dns_lookups_total prometheus_sd_failed_configs prometheus_sd_file_read_errors_total prometheus_sd_file_scan_duration_seconds prome
theus_sd_file_scan_duration_seconds_count prometheus_sd_file_scan_duration_seconds_sum prometheus_sd_kubernetes_events_total prometheus_sd_received_updates_total prometheus_sd_updat
es_total prometheus_target_interval_length_seconds prometheus_target_interval_length_seconds_count prometheus_target_interval_length_seconds_sum prometheus_target_metadata_cache_byt
es prometheus_target_metadata_cache_entries prometheus_target_scrape_pool_exceeded_label_limits_total prometheus_target_scrape_pool_exceeded_target_limit_total prometheus_target_scr
ape_pool_reloads_failed_total prometheus_target_scrape_pool_reloads_total prometheus_target_scrape_pool_sync_total prometheus_target_scrape_pool_targets prometheus_target_scrape_poo
ls_failed_total prometheus_target_scrape_pools_total prometheus_target_scrapes_cache_flush_forced_total prometheus_target_scrapes_exceeded_body_size_limit_total prometheus_target_sc
rapes_exceeded_sample_limit_total prometheus_target_scrapes_exemplar_out_of_order_total prometheus_target_scrapes_sample_duplicate_timestamp_total prometheus_target_scrapes_sample_o
ut_of_bounds_total prometheus_target_scrapes_sample_out_of_order_total prometheus_target_sync_failed_total prometheus_target_sync_length_seconds prometheus_target_sync_length_second
s_count prometheus_target_sync_length_seconds_sum prometheus_template_text_expansion_failures_total prometheus_template_text_expansions_total prometheus_treecache_watcher_goroutines
 prometheus_treecache_zookeeper_failures_total prometheus_tsdb_blocks_loaded prometheus_tsdb_checkpoint_creations_failed_total prometheus_tsdb_checkpoint_creations_total prometheus_
tsdb_checkpoint_deletions_failed_total prometheus_tsdb_checkpoint_deletions_total prometheus_tsdb_clean_start prometheus_tsdb_compaction_chunk_range_seconds_bucket prometheus_tsdb_c
ompaction_chunk_range_seconds_count prometheus_tsdb_compaction_chunk_range_seconds_sum prometheus_tsdb_compaction_chunk_samples_bucket prometheus_tsdb_compaction_chunk_samples_count
 prometheus_tsdb_compaction_chunk_samples_sum prometheus_tsdb_compaction_chunk_size_bytes_bucket prometheus_tsdb_compaction_chunk_size_bytes_count prometheus_tsdb_compaction_chunk_s
ize_bytes_sum prometheus_tsdb_compaction_duration_seconds_bucket prometheus_tsdb_compaction_duration_seconds_count prometheus_tsdb_compaction_duration_seconds_sum prometheus_tsdb_co
mpaction_populating_block prometheus_tsdb_compactions_failed_total prometheus_tsdb_compactions_skipped_total prometheus_tsdb_compactions_total prometheus_tsdb_compactions_triggered_
total prometheus_tsdb_data_replay_duration_seconds prometheus_tsdb_head_active_appenders prometheus_tsdb_head_chunks prometheus_tsdb_head_chunks_created_total prometheus_tsdb_head_c
hunks_removed_total prometheus_tsdb_head_gc_duration_seconds_count prometheus_tsdb_head_gc_duration_seconds_sum prometheus_tsdb_head_max_time prometheus_tsdb_head_max_time_seconds p
rometheus_tsdb_head_min_time prometheus_tsdb_head_min_time_seconds prometheus_tsdb_head_samples_appended_total prometheus_tsdb_head_series prometheus_tsdb_head_series_created_total
prometheus_tsdb_head_series_not_found_total prometheus_tsdb_head_series_removed_total prometheus_tsdb_head_truncations_failed_total prometheus_tsdb_head_truncations_total prometheus
_tsdb_isolation_high_watermark prometheus_tsdb_isolation_low_watermark prometheus_tsdb_lowest_timestamp prometheus_tsdb_lowest_timestamp_seconds prometheus_tsdb_mmap_chunk_corruptio
ns_total prometheus_tsdb_out_of_bound_samples_total prometheus_tsdb_out_of_order_samples_total prometheus_tsdb_reloads_failures_total prometheus_tsdb_reloads_total prometheus_tsdb_s
ize_retentions_total prometheus_tsdb_storage_blocks_bytes prometheus_tsdb_symbol_table_size_bytes prometheus_tsdb_time_retentions_total prometheus_tsdb_tombstone_cleanup_seconds_buc
ket prometheus_tsdb_tombstone_cleanup_seconds_count prometheus_tsdb_tombstone_cleanup_seconds_sum prometheus_tsdb_vertical_compactions_total prometheus_tsdb_wal_completed_pages_tota
l prometheus_tsdb_wal_corruptions_total prometheus_tsdb_wal_fsync_duration_seconds prometheus_tsdb_wal_fsync_duration_seconds_count prometheus_tsdb_wal_fsync_duration_seconds_sum pr
ometheus_tsdb_wal_page_flushes_total prometheus_tsdb_wal_segment_current prometheus_tsdb_wal_truncate_duration_seconds_count prometheus_tsdb_wal_truncate_duration_seconds_sum promet
heus_tsdb_wal_truncations_failed_total prometheus_tsdb_wal_truncations_total prometheus_tsdb_wal_writes_failed_total prometheus_web_federation_errors_total prometheus_web_federation
_warnings_total promhttp_metric_handler_errors_total promhttp_metric_handler_requests_in_flight promhttp_metric_handler_requests_total scrape_duration_seconds scrape_samples_post_me
tric_relabeling scrape_samples_scraped scrape_series_added zk_approximate_data_size zk_avg_latency zk_ephemerals_count zk_max_file_descriptor_count zk_max_latency zk_min_latency zk_
num_alive_connections zk_outstanding_requests zk_packets_received zk_packets_sent zk_server_leader zk_watch_count]
数据查询效果
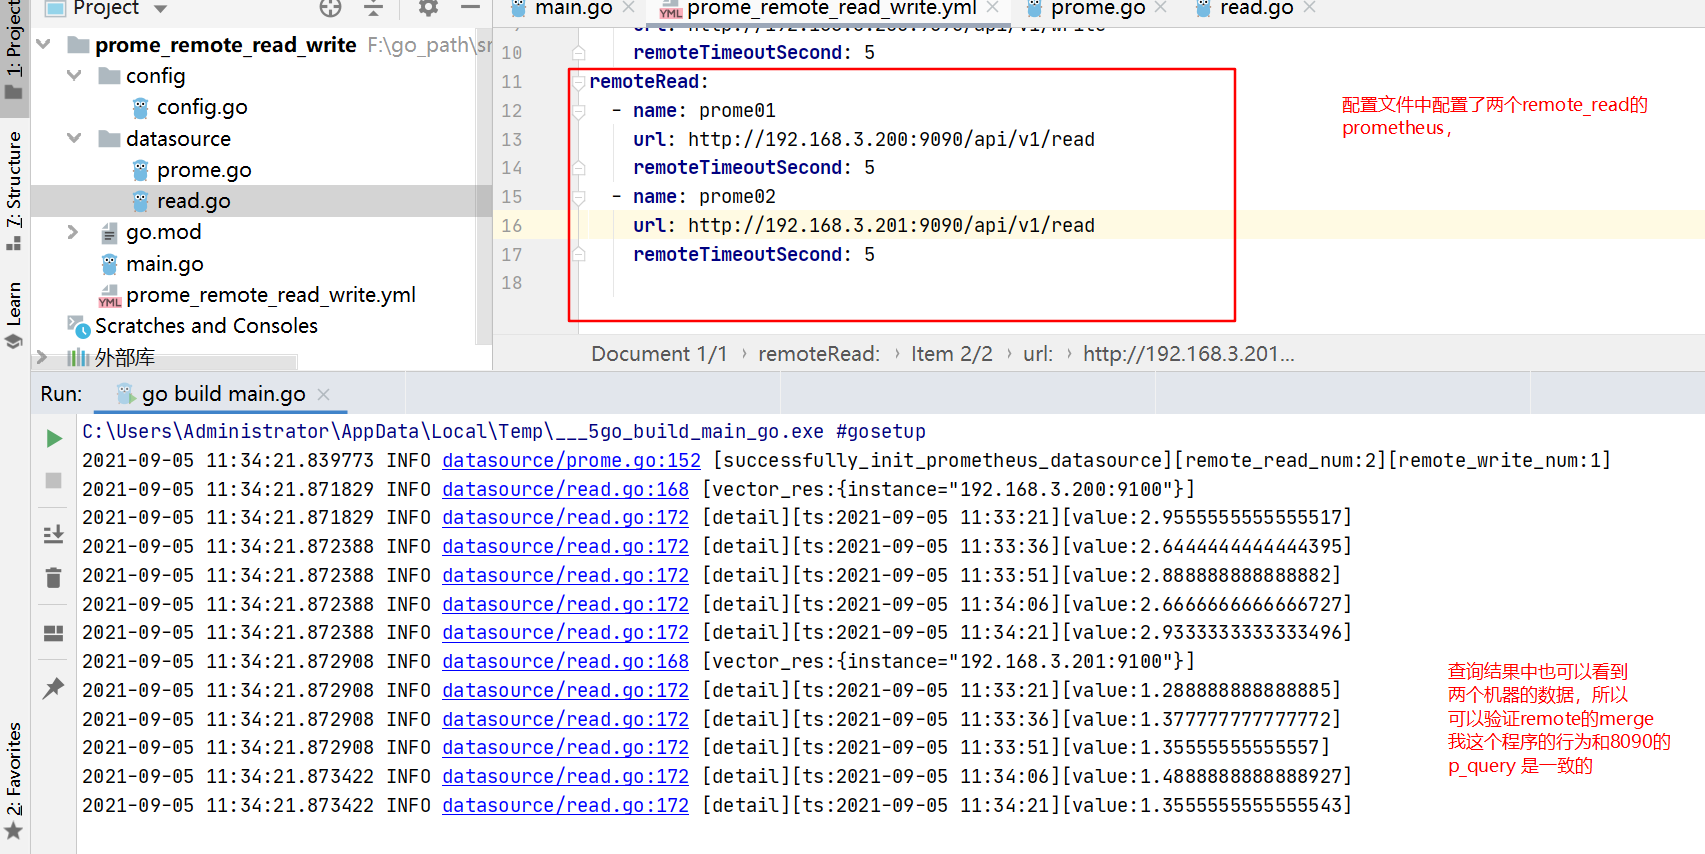
2021-08-31 15:42:36.299303 INFO datasource/prome.go:149 [successfully_init_prometheus_datasource][remote_read_num:1][remote_write_num:1]
2021-08-31 15:42:36.353459 INFO datasource/read.go:170 [vector_res:{instance="172.20.70.205:9100"}]
2021-08-31 15:42:36.353459 INFO datasource/read.go:174 [detail][ts:2021-08-31 15:37:36][value:0.9799999999991591]
2021-08-31 15:42:36.353459 INFO datasource/read.go:174 [detail][ts:2021-08-31 15:37:51][value:0.9244444444468375]
2021-08-31 15:42:36.353459 INFO datasource/read.go:174 [detail][ts:2021-08-31 15:38:06][value:0.9866666666671843]
2021-08-31 15:42:36.353459 INFO datasource/read.go:174 [detail][ts:2021-08-31 15:38:21][value:0.9711111111116931]
2021-08-31 15:42:36.353459 INFO datasource/read.go:174 [detail][ts:2021-08-31 15:38:36][value:1.0466666666664726]
2021-08-31 15:42:36.353459 INFO datasource/read.go:174 [detail][ts:2021-08-31 15:38:51][value:0.9866666666671841]
2021-08-31 15:42:36.353969 INFO datasource/read.go:174 [detail][ts:2021-08-31 15:39:06][value:1.0422222222211226]
2021-08-31 15:42:36.353969 INFO datasource/read.go:174 [detail][ts:2021-08-31 15:39:21][value:0.9999999999983831]
2021-08-31 15:42:36.353969 INFO datasource/read.go:174 [detail][ts:2021-08-31 15:39:36][value:1.0955555555556202]
2021-08-31 15:42:36.353969 INFO datasource/read.go:174 [detail][ts:2021-08-31 15:39:51][value:1.0111111111133746]
2021-08-31 15:42:36.353969 INFO datasource/read.go:174 [detail][ts:2021-08-31 15:40:06][value:1.09111111111027]
2021-08-31 15:42:36.353969 INFO datasource/read.go:174 [detail][ts:2021-08-31 15:40:21][value:1.0488888888907644]
2021-08-31 15:42:36.353969 INFO datasource/read.go:174 [detail][ts:2021-08-31 15:40:36][value:1.1111111111127279]
2021-08-31 15:42:36.353969 INFO datasource/read.go:174 [detail][ts:2021-08-31 15:40:51][value:1.015555555555491]
2021-08-31 15:42:36.353969 INFO datasource/read.go:174 [detail][ts:2021-08-31 15:41:06][value:1.0688888888883716]
2021-08-31 15:42:36.353969 INFO datasource/read.go:174 [detail][ts:2021-08-31 15:41:21][value:1.017777777776549]
2021-08-31 15:42:36.355022 INFO datasource/read.go:174 [detail][ts:2021-08-31 15:41:36][value:1.057777777781464]
2021-08-31 15:42:36.355532 INFO datasource/read.go:174 [detail][ts:2021-08-31 15:41:51][value:1.02888888888669]
2021-08-31 15:42:36.355532 INFO datasource/read.go:174 [detail][ts:2021-08-31 15:42:06][value:1.1488888888901176]
2021-08-31 15:42:36.355532 INFO datasource/read.go:174 [detail][ts:2021-08-31 15:42:21][value:1.1066666666657612]
2021-08-31 15:42:36.355532 INFO datasource/read.go:174 [detail][ts:2021-08-31 15:42:36][value:1.0822222222228042]
2021-08-31 15:42:36.356044 INFO datasource/read.go:170 [vector_res:{instance="172.20.70.215:9100"}]
2021-08-31 15:42:36.356044 INFO datasource/read.go:174 [detail][ts:2021-08-31 15:37:36][value:0.5377777777777939]
2021-08-31 15:42:36.356575 INFO datasource/read.go:174 [detail][ts:2021-08-31 15:37:51][value:0.5999999999999596]
2021-08-31 15:42:36.356575 INFO datasource/read.go:174 [detail][ts:2021-08-31 15:38:06][value:0.4777777777776969]
2021-08-31 15:42:36.356575 INFO datasource/read.go:174 [detail][ts:2021-08-31 15:38:21][value:0.5711111111108442]
2021-08-31 15:42:36.356575 INFO datasource/read.go:174 [detail][ts:2021-08-31 15:38:36][value:0.5044444444441372]
2021-08-31 15:42:36.357086 INFO datasource/read.go:174 [detail][ts:2021-08-31 15:38:51][value:0.5999999999999595]
2021-08-31 15:42:36.357086 INFO datasource/read.go:174 [detail][ts:2021-08-31 15:39:06][value:0.5066666666668123]
2021-08-31 15:42:36.357086 INFO datasource/read.go:174 [detail][ts:2021-08-31 15:39:21][value:0.6355555555556849]
2021-08-31 15:42:36.357086 INFO datasource/read.go:174 [detail][ts:2021-08-31 15:39:36][value:0.531111111111386]
2021-08-31 15:42:36.357086 INFO datasource/read.go:174 [detail][ts:2021-08-31 15:39:51][value:0.6577777777777859]
2021-08-31 15:42:36.357596 INFO datasource/read.go:174 [detail][ts:2021-08-31 15:40:06][value:0.5288418807215358]
2021-08-31 15:42:36.357596 INFO datasource/read.go:174 [detail][ts:2021-08-31 15:40:21][value:0.6422222222218906]
2021-08-31 15:42:36.357596 INFO datasource/read.go:174 [detail][ts:2021-08-31 15:40:36][value:0.5244444444443717]
2021-08-31 15:42:36.357596 INFO datasource/read.go:174 [detail][ts:2021-08-31 15:40:51][value:0.6556138323412185]
2021-08-31 15:42:36.357596 INFO datasource/read.go:174 [detail][ts:2021-08-31 15:41:06][value:0.5555555555553534]
2021-08-31 15:42:36.358105 INFO datasource/read.go:174 [detail][ts:2021-08-31 15:41:21][value:0.6177777777775191]
2021-08-31 15:42:36.358105 INFO datasource/read.go:174 [detail][ts:2021-08-31 15:41:36][value:0.519999999999426]
2021-08-31 15:42:36.358105 INFO datasource/read.go:174 [detail][ts:2021-08-31 15:41:51][value:0.657777777777988]
2021-08-31 15:42:36.358105 INFO datasource/read.go:174 [detail][ts:2021-08-31 15:42:06][value:0.620000000000194]
2021-08-31 15:42:36.358105 INFO datasource/read.go:174 [detail][ts:2021-08-31 15:42:21][value:0.6711111111114101]
2021-08-31 15:42:36.358105 INFO datasource/read.go:174 [detail][ts:2021-08-31 15:42:36][value:0.6066666666667717]
验证merge的结果,配置两个prometheus后端
本节重点总结 :
- remote_read代码需求
- 查询一个标签的值列表
- 查询一段时间的数据
- remote_read代码需求
- 查询一个标签的值列表
- 查询一段时间的数据
- 通用的查询series方法
- 查询一个标签的值列表
- 查询一段时间的数据
33.7 write的代码编写和测试
本节重点介绍 :
- prometheus的proto编码 和压缩
- 带retry的写入管理器
- 写入的post函数判断是否是可恢复的错误决定是否重试
开启prometheus 队列消费协程
- 位置 datasource\prome.go
- 接收队列中传来的数据,转换推送即可
package datasource

import (
	"bufio"
	"bytes"
	"context"
	"fmt"
	"github.com/gogo/protobuf/proto"
	"github.com/golang/snappy"
	"github.com/opentracing-contrib/go-stdlib/nethttp"
	"github.com/opentracing/opentracing-go"
	"github.com/pkg/errors"
	"github.com/prometheus/common/model"
	"github.com/prometheus/prometheus/pkg/labels"
	"github.com/prometheus/prometheus/prompb"
	"github.com/toolkits/pkg/logger"
	"io"
	"io/ioutil"
	"math/rand"
	"net/http"
	"regexp"
	"time"
)

func (pd *PromeDataSource) remoteWrite() {

	for {
		select {
		case pbItems := <-pd.PushQueue:
			payload, err := pd.buildWriteRequest(pbItems)
			if err != nil {
				logger.Errorf("[prome_remote_write_error][pb_marshal_error][items: %+v][pb.err: %v]: ", pbItems, err)
				continue
			}
			pd.processWrite(payload)
		}

	}
}
proto编码 和压缩
func (pd *PromeDataSource) buildWriteRequest(samples []prompb.TimeSeries) ([]byte, error) {

	req := &prompb.WriteRequest{
		Timeseries: samples,
		Metadata:   nil,
	}

	data, err := proto.Marshal(req)
	if err != nil {
		return nil, err
	}

	compressed := snappy.Encode(nil, data)
	return compressed, nil
}
带retry的写入管理器
- 遍历后端的WriteTargets,用协程写入
- 判断返回错误
type RecoverableError struct {
	error
}

func (pd *PromeDataSource) processWrite(payload []byte) {

	retry := 3

	for _, c := range pd.WriteTargets {
		newC := c
		go func(cc *HttpClient, payload []byte) {
			sendOk := false
			var rec bool
			var finalErr error
			for i := 0; i < retry; i++ {
				err := remoteWritePost(cc, payload)
				if err == nil {
					sendOk = true
					break
				}

				_, rec = err.(RecoverableError)

				if !rec {
					finalErr = err
					break
				}
				logger.Warningf("[send prome fail recoverableError][retry: %d/%d][err:%v]", i+1, retry, err)
				time.Sleep(time.Millisecond * 100)
			}
			if !sendOk {
				logger.Errorf("send prome finally fail: %v", finalErr)
			} else {
				logger.Debugf("send to prome %s ok", cc.url.String())
			}
		}(newC, payload)
	}

}
写入的post函数
- 如果错误为5xx httpResp.StatusCode/100 == 5 ,则认为是可恢复的错误,继续重试
- 如果错误为4xx 400的错误是客户端的问题,不返回给上层,输出到debug日志中
func remoteWritePost(c *HttpClient, req []byte) error {
	httpReq, err := http.NewRequest("POST", c.url.String(), bytes.NewReader(req))
	if err != nil {
		// Errors from NewRequest are from unparsable URLs, so are not
		// recoverable.
		return err
	}

	httpReq.Header.Add("Content-Encoding", "snappy")
	httpReq.Header.Set("Content-Type", "application/x-protobuf")
	httpReq.Header.Set("User-Agent", "n9e-v5")
	httpReq.Header.Set("X-Prometheus-Remote-Write-Version", "0.1.0")
	ctx, cancel := context.WithTimeout(context.Background(), c.timeout)
	defer cancel()

	httpReq = httpReq.WithContext(ctx)

	if parentSpan := opentracing.SpanFromContext(ctx); parentSpan != nil {
		var ht *nethttp.Tracer
		httpReq, ht = nethttp.TraceRequest(
			parentSpan.Tracer(),
			httpReq,
			nethttp.OperationName("Remote Store"),
			nethttp.ClientTrace(false),
		)
		defer ht.Finish()
	}

	httpResp, err := c.Client.Do(httpReq)
	if err != nil {
		// Errors from Client.Do are from (for example) network errors, so are
		// recoverable.
		return RecoverableError{err}
	}
	defer func() {
		io.Copy(ioutil.Discard, httpResp.Body)
		httpResp.Body.Close()
	}()

	if httpResp.StatusCode/100 != 2 {
		scanner := bufio.NewScanner(io.LimitReader(httpResp.Body, 512))
		line := ""
		if scanner.Scan() {
			line = scanner.Text()
		}

		if httpResp.StatusCode == 400 {
			//400的错误是客户端的问题,不返回给上层,输出到debug日志中
			logger.Debugf("server returned HTTP status %s: %s req:%v", httpResp.Status, line, getSamples(req))
		} else {
			err = errors.Errorf("server returned HTTP status %s: %s", httpResp.Status, line)
		}
	}

	if httpResp.StatusCode/100 == 5 {
		return RecoverableError{err}
	}
	return err
}

func getSamples(compressed []byte) []prompb.TimeSeries {
	var samples []prompb.TimeSeries
	req := &prompb.WriteRequest{
		Timeseries: samples,
		Metadata:   nil,
	}

	d, _ := snappy.Decode(nil, compressed)
	proto.Unmarshal(d, req)

	return req.Timeseries
}
测试写入数据的入口
- 有一个公共的metrics前缀
- mock一些标签数据
- 调用转换函数 convertOne转换
- 将结果推入chan中
func (pd *PromeDataSource) WriteTest() {
	for {
		metricNamePrefix := "metrics_gen_by_remote_write_code_"

		randMapKeys := []string{"arch", "idc", "os", "jobname"}
		randMapValues := []string{"linux", "beijing", "centos", "arm64"}
		frn := func(n int) int {
			return rand.Intn(n)
		}
		pts := []prompb.TimeSeries{}
		for i := 0; i < 10; i++ {
			name := fmt.Sprintf("%s_%d", metricNamePrefix, i)
			num := len(randMapKeys)
			m := make(map[string]string, num)
			for i := 0; i < num; i++ {
				m[randMapKeys[frn(len(randMapKeys)-1)]] = randMapValues[frn(len(randMapValues)-1)]
			}
			pt, err := pd.convertOne(name, m, float64(rand.Intn(1000)))
			if err != nil {
				continue
			}
			pts = append(pts, pt)
		}
		pd.PushQueue <- pts
		time.Sleep(15 * time.Second)
	}
}
转换函数
- 先校验下metrics是否符合正则要求
- 调用labelsToLabelsProto 将标签转换为protocol buf格式
type sample struct {
	labels labels.Labels
	t      int64
	v      float64
}

func (pd *PromeDataSource) convertOne(metricName string, labelsMap map[string]string, value float64) (prompb.TimeSeries, error) {
	pt := prompb.TimeSeries{}
	pt.Samples = []prompb.Sample{{}}
	s := sample{}
	s.t = time.Now().Unix()
	s.v = value
	// name
	if !MetricNameRE.MatchString(metricName) {
		return pt, errors.New("invalid metrics name")
	}
	nameLs := labels.Label{
		Name:  "__name__",
		Value: metricName,
	}
	s.labels = append(s.labels, nameLs)

	for k, v := range labelsMap {
		if model.LabelNameRE.MatchString(k) {
			ls := labels.Label{
				Name:  k,
				Value: v,
			}
			s.labels = append(s.labels, ls)

		}

	}

	pt.Labels = labelsToLabelsProto(s.labels, pt.Labels)
	// 时间赋值问题,使用毫秒时间戳
	tsMs := time.Unix(s.t, 0).UnixNano() / 1e6
	pt.Samples[0].Timestamp = tsMs
	pt.Samples[0].Value = s.v
	return pt, nil
}

var MetricNameRE = regexp.MustCompile(`^[a-zA-Z_:][a-zA-Z0-9_:]*$`)

func labelsToLabelsProto(labels labels.Labels, buf []prompb.Label) []prompb.Label {
	result := buf[:0]
	if cap(buf) < len(labels) {
		result = make([]prompb.Label, 0, len(labels))
	}
	for _, l := range labels {
		result = append(result, prompb.Label{
			Name:  l.Name,
			Value: l.Value,
		})
	}
	return result
}
prometheus 远程写入接收器允许 Prometheus 接受来自其他 Prometheus 服务器的远程写入请求
--enable-feature=remote-write-receivermain中写入测试数据
func main() {
	rand.Seed(time.Now().UnixNano())
	configFile := flag.String("config", "prome_remote_read_write.yml",
		"Address on which to expose metrics and web interface.")
	flag.Parse()

	sConfig, err := config.LoadFile(*configFile)
	if err != nil {
		logger.Infof("config.LoadFile Error,Exiting ...error:%v", err)
		return
	}

	pd := datasource.NewPromeDataSource(sConfig)
	pd.Init()
	go pd.WriteTest()
	select {}

}
观察日志
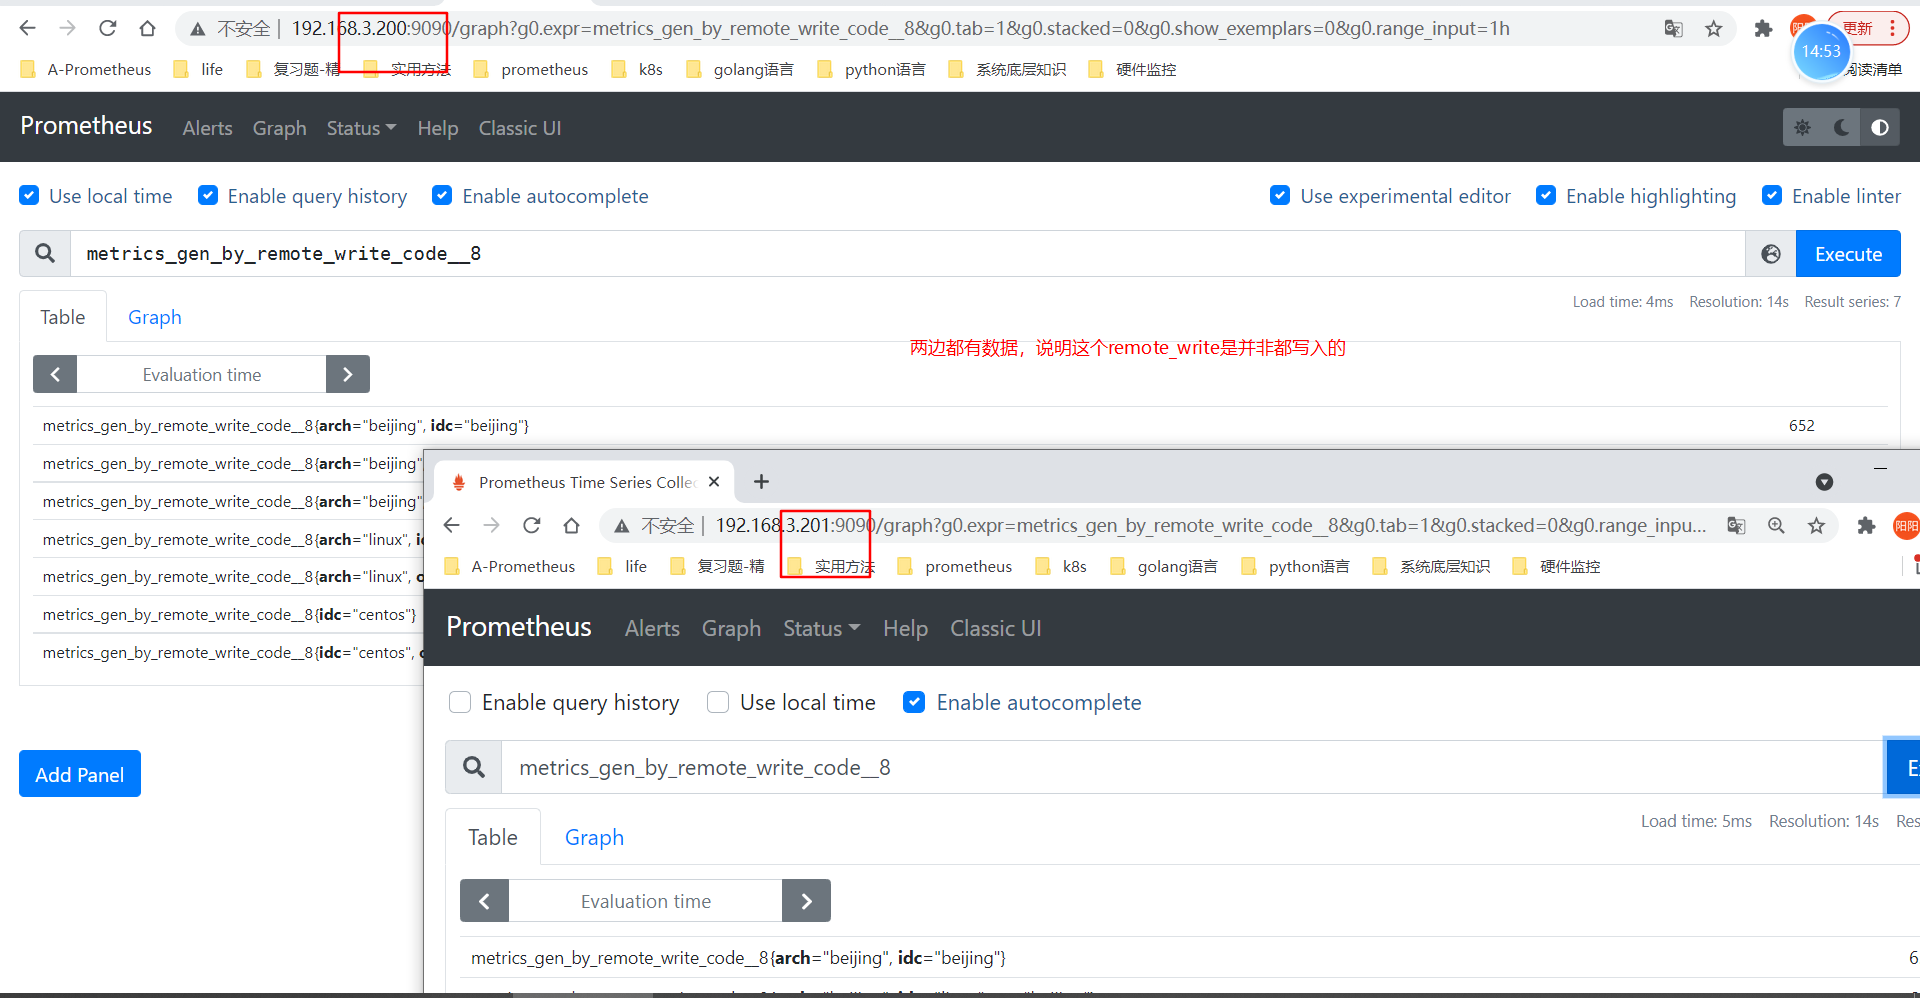
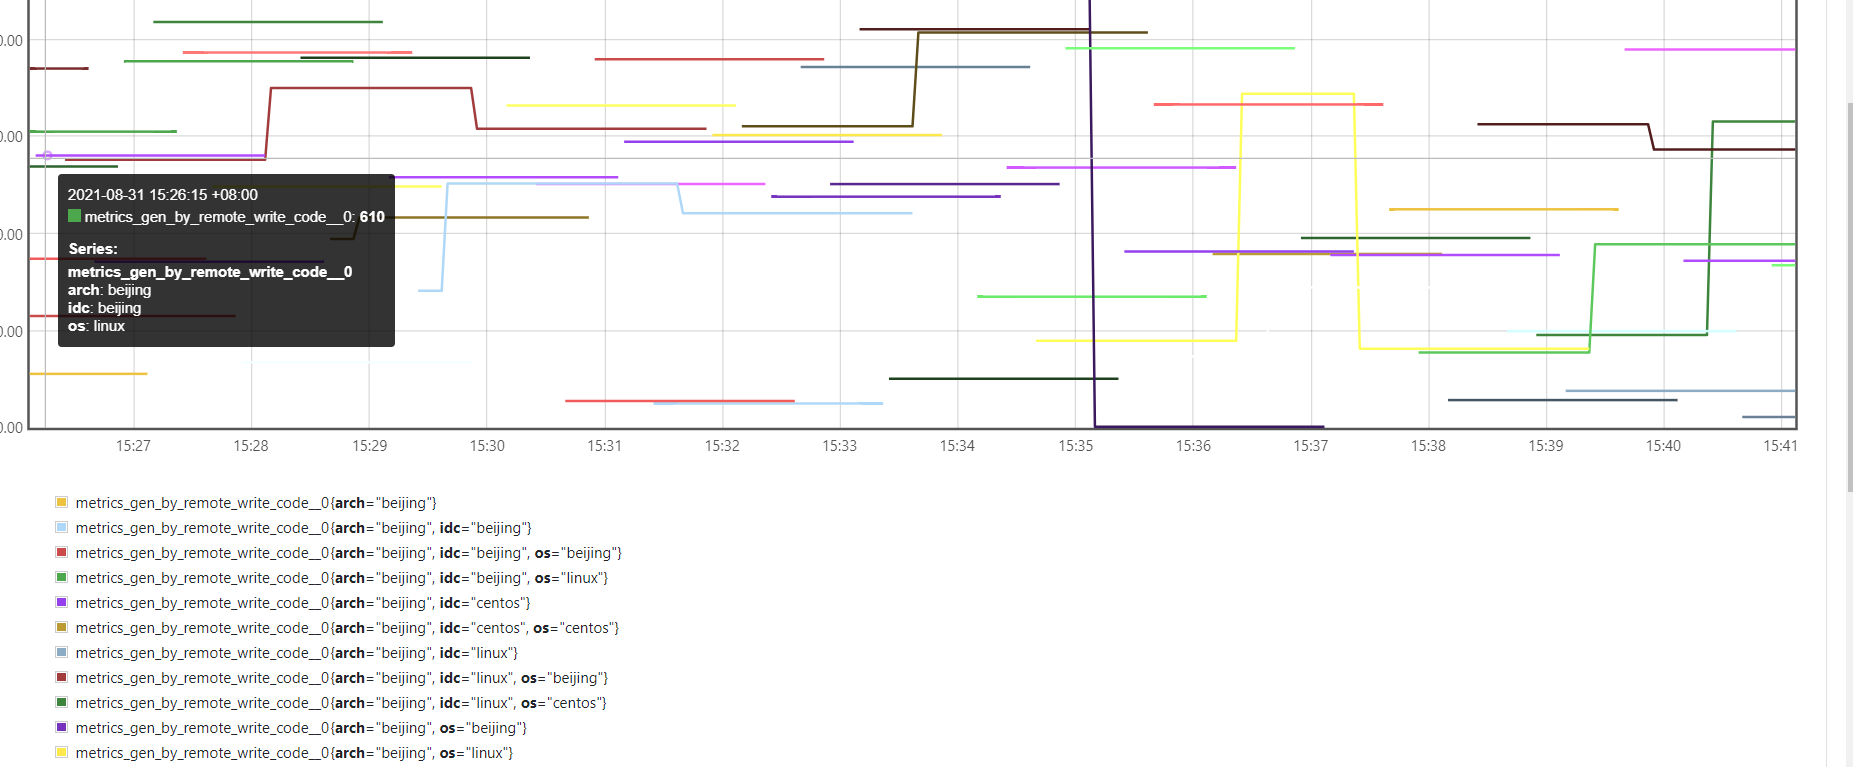
2021-08-31 15:59:10.260790 DEBUG datasource/write.go:74 send to prome http://172.20.70.205:9090/api/v1/write ok
2021-08-31 15:59:25.263606 DEBUG datasource/write.go:74 send to prome http://172.20.70.205:9090/api/v1/write ok
2021-08-31 15:59:40.273120 DEBUG datasource/write.go:74 send to prome http://172.20.70.205:9090/api/v1/write ok
2021-08-31 15:59:55.288338 DEBUG datasource/write.go:74 send to prome http://172.20.70.205:9090/api/v1/write ok
本节重点总结 :
- prometheus的proto编码 和压缩
- 带retry的写入管理器
- 写入的post函数判断是否是可恢复的错误决定是否重试
33.1 prometheus本地存储单点问题和remote解决方案
本节重点介绍 :
- prometheus本地存储单点问题
- 官方提供的remote集成方法
- 现有支持的远程端点和存储
prometheus本地存储问题
Prometheus的本地存储仅限于单个节点的可伸缩性和持久性。Prometheus并没有尝试解决Prometheus本身中的集群存储,而是提供了一组允许与远程存储系统集成的接口。
官方提供的remote集成方法

Prometheus通过以下三种方式与远程存储系统集成:
- Prometheus可以将其提取的样本以标准格式写入远程URL。
- Prometheus可以以标准格式从其他Prometheus服务器接收样本。
- Prometheus可以以标准化格式从远程URL读取(返回)样本数据。
读取和写入协议都使用基于HTTP的快速压缩协议缓冲区编码
- 该协议尚未被认为是稳定的API,当可以安全地假定Prometheus和远程存储之间的所有跃点都支持HTTP / 2时,该协议将来可能会更改为在HTTP / 2上使用gRPC。
不支持分布式promql,数据需要在查询端完成
- 请注意,在读取路径上,Prometheus仅从远端获取一组标签选择器和时间范围的原始系列数据
- PromQL对原始数据的所有评估仍然在Prometheus本身中进行
- 这意味着远程读取查询具有一定的可伸缩性限制,因为所有必需的数据都需要先加载到查询的Prometheus服务器中,然后再在该服务器中进行处理。
- 但是,暂时认为支持PromQL的完全分布式评估是不可行的。
现有支持的远程端点和存储
注意是各个存储在内部代码中适配prometheus
不是prometheus适配其他存储,可见大家都在抱prometheus大腿
- Prometheus的远程写入和远程读取功能允许透明地发送和接收样本。这主要用于长期存储
读写都支持的存储
- AWS Timestream
- Azure Data Explorer
- Cortex
- CrateDB
- Google BigQuery
- Google Cloud Spanner
- InfluxDB
- IRONdb
- M3DB
- PostgreSQL/TimescaleDB
- QuasarDB
- Splunk
- Thanos
- TiKV
只支持写入的存储
- AppOptics
- Azure
- Chronix
- Elasticsearch
- Gnocchi
- Graphite
- Instana
- Kafka
- New
- OpenTSDB
- SignalFx
- VictoriaMetrics
- Wavefront
没有只支持读而不支持写入的存储,数据进不去读没意义
本节重点总结 :
- prometheus本地存储单点问题
- 官方提供的remote集成方法
- 现有支持的远程端点和存储
33.2 prometheus联邦功能源码解读和它的问题
本节重点介绍 :
- prometheus 联邦使用的误解
- federate源码分析
prometheus 联邦使用的误解
- 我看到很多人会这样使用联邦:联邦prometheus 收集多个采集器的数据
- 实在看不下下去了,很多小白还在乱用
prometheus的联邦 - 其实很多人是想实现prometheus数据的可用性,数据分片保存,有个统一的查询地方(小白中的联邦prometheus)
- 今天写篇文章分析下联邦的问题,并给出一个基于全部是prometheus的
multi_remote_read方案
联邦问题
联邦使用配偶样例
- 本质上就是采集级联
- 说白了就是 a 从 b,c,d那里再采集数据过来
- 可以搭配match指定只拉取某些指标
- 下面就是官方文档给出的样例
scrape_configs:
  - job_name: 'federate'
    scrape_interval: 15s

    honor_labels: true
    metrics_path: '/federate'

    params:
      'match[]':
        - '{job="prometheus"}'
        - '{__name__=~"job:.*"}'

    static_configs:
      - targets:
        - 'source-prometheus-1:9090'
        - 'source-prometheus-2:9090'
        - 'source-prometheus-3:9090'
federate源码分析
看上面的样例配置怎么感觉是采集的配置呢
- 不用怀疑就是,下面看看代码分析一下
- 从上述配置可以看到采集的 path是
/federate - 代码位置 D:\go_path\src\github.com\prometheus\prometheus\web\web.go
    // web.go 的 federate Handler
	router.Get("/federate", readyf(httputil.CompressionHandler{
		Handler: http.HandlerFunc(h.federation),
	}.ServeHTTP))
分析下联邦http处理函数 说白了就是读取本地存储数据处理
- 代码位置 D:\go_path\src\github.com\prometheus\prometheus\web\federate.go
func (h *Handler) federation(w http.ResponseWriter, req *http.Request) {

	// localstorage 的query
	q, err := h.localStorage.Querier(req.Context(), mint, maxt)

	defer q.Close()
	// 最终发送的Vector 数组
	vec := make(promql.Vector, 0, 8000)

	hints := &storage.SelectHints{Start: mint, End: maxt}

	var sets []storage.SeriesSet

	set := storage.NewMergeSeriesSet(sets, storage.ChainedSeriesMerge)
    // 遍历存储中的full series
	for set.Next() {
		s := set.At()

		vec = append(vec, promql.Sample{
			Metric: s.Labels(),
			Point:  promql.Point{T: t, V: v},
		})

	for _, s := range vec {
		nameSeen := false
		globalUsed := map[string]struct{}{}
		protMetric := &dto.Metric{
			Untyped: &dto.Untyped{},
		}
        // Encode方法根据请求类型编码
				if protMetricFam != nil {
					if err := enc.Encode(protMetricFam); err != nil {
						federationErrors.Inc()
						level.Error(h.logger).Log("msg", "federation failed", "err", err)
						return
					}
				}

		}

		protMetric.TimestampMs = proto.Int64(s.T)
		protMetric.Untyped.Value = proto.Float64(s.V)

		protMetricFam.Metric = append(protMetricFam.Metric, protMetric)
	}
	//
	if protMetricFam != nil {
		if err := enc.Encode(protMetricFam); err != nil {
			federationErrors.Inc()
			level.Error(h.logger).Log("msg", "federation failed", "err", err)
		}
	}
}
解读一下
- 因为是将本地的数据发送走,所以首先创建一个localstorage 的Querier
q, err := h.localStorage.Querier(req.Context(), mint, maxt)- 构造发送数据用的vector 容器
	// 最终发送的Vector 数组
vec := make(promql.Vector, 0, 8000)- 遍历存储中的full series,塞入数据
    // 遍历存储中的full series
	for set.Next() {
		s := set.At()

		vec = append(vec, promql.Sample{
			Metric: s.Labels(),
			Point:  promql.Point{T: t, V: v},
})- 对vector 容器数据进行排序,并准备一会要注入的外部标签组externalLabelNames
	sort.Sort(byName(vec))

	externalLabels := h.config.GlobalConfig.ExternalLabels.Map()
	if _, ok := externalLabels[model.InstanceLabel]; !ok {
		externalLabels[model.InstanceLabel] = ""
	}
	externalLabelNames := make([]string, 0, len(externalLabels))
	for ln := range externalLabels {
		externalLabelNames = append(externalLabelNames, ln)
	}
sort.Strings(externalLabelNames)- 遍历vector,进行protocol 编码,并注入externalLabel
	for _, s := range vec {
				for _, ln := range externalLabelNames {
			lv := externalLabels[ln]
			if _, ok := globalUsed[ln]; !ok {
				protMetric.Label = append(protMetric.Label, &dto.LabelPair{
					Name:  proto.String(ln),
					Value: proto.String(lv),
				})
			}
		}

		protMetric.TimestampMs = proto.Int64(s.T)
		protMetric.Untyped.Value = proto.Float64(s.V)

		protMetricFam.Metric = append(protMetricFam.Metric, protMetric)
    }
最终调用压缩函数压缩发送数据
- 代码位置 D:\go_path\src\github.com\prometheus\prometheus\util\httputil\compression.go
type CompressionHandler struct {
	Handler http.Handler
}

// ServeHTTP adds compression to the original http.Handler's ServeHTTP() method.
func (c CompressionHandler) ServeHTTP(writer http.ResponseWriter, req *http.Request) {
	compWriter := newCompressedResponseWriter(writer, req)
	c.Handler.ServeHTTP(compWriter, req)
	compWriter.Close()
}
federate问题结论
如果没有过滤那么只是一股脑把分片的数据集中到了一起,没意义
- 很多时候是因为数据量太大了,分散在多个采集器的数据是不能被一个联邦消化的
正确使用联邦的姿势
- 使用match加过滤,将采集数据分位两类
- 第一类需要再聚合的数据,通过联邦收集在一起
- 举个例子
- 只收集中间件的数据的联邦
- 只收集业务数据的联邦
- 举个例子
- 其余数据保留在采集器本地即可
- 第一类需要再聚合的数据,通过联邦收集在一起
- 这样可以在各个联邦上执行
预聚合和alert,使得查询速度提升
默认prometheus是不支持降采样的
- 可以在联邦配置scrape_interval的时候设置的大一点来达到 模拟降采样的目的
- 真实的降采样需要agg算法支持的,比如5分钟的数据算平均值、最大值、最小值保留,而不是这种把采集间隔调大到5分钟的随机选点逻辑
正确实现统一查询的姿势是使用prometheus multi_remote_read
本节重点总结 :
- prometheus 联邦使用的误解
- federate源码分析
33.3 prometheus 低成本存储multi_remote_read方案说明
本节重点介绍 :
prometheus 低成本存储multi_remote_read方案说明
- 数据重复怎么办
配置prometheus remote_read prometheus
架构图
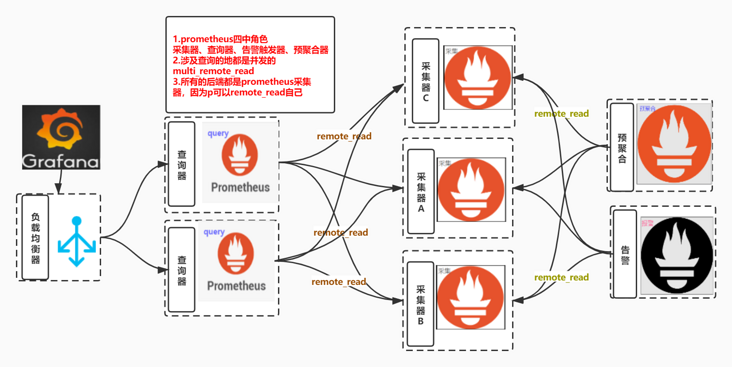
multi_remote_read方案说明
如果我们配置了多个remote_read 接口的话即可实现 multi
remote_read:
  - url: "http://172.20.70.205:9090/api/v1/read"
    read_recent: true
  - url: "http://172.20.70.215:9090/api/v1/read"
    read_recent: true
上述配置代表并发查询两个后端存储,并可以对查询的结果进行merge
- merge有啥用: 以为着你们的查询promql或者alert配置文件无需关心数据到底存储在哪个存储里面
- 可以直接使用全局的聚合函数
prometheus可以remote_read prometheus自己
- 感觉这个特点很多人不知道,以为remote_read必须配置第三方存储如 m3db等
所以结合上述两个特点就可以用多个采集的prometheus + 多个无状态的prometheus query实现prometheus的高可用方案
- 监控数据存储在多个采集器的本地,可以是机器上的prometheus
- 也可以是k8s中的prometheus statefulset
- prometheus query remote_read 填写多个
prometheus/api/v1/read/地址
数据重复怎么办
- 不用管,上面提到了query会做merge,多个数据只会保留一份
- 到正可以利用这个特点模拟副本机制:
- 重要的采集job由两个以上的采集prometheus采集
- 查询的时候merge数据
- 可以避免其中一个挂掉时没数据的问题
那么这种方案的缺点在哪里
并发查询必须要等最慢的那个返回才返回,所以如果有个慢的节点会导致查询速度下降,举个例子
- 有个美东的节点,网络基础延迟是1秒,那么所有查询无论返回多快都必须叠加1秒的延迟
应对重查询时可能会把query打挂
- 但也正是这个特点,会很好的保护后端存储分片
- 重查询的基数分散给多个采集器了
由于是无差别的并发query,也就是说所有的query都会打向所有的采集器,会导致一些采集器总是查询不存在他这里的数据
- 那么一个关键性的问题就是,查询不存在这个prometheus的数据的资源开销到底是多少
- 据我观察,新版本速度还是很快的说明资源开销不会在很深的地方才判断出不属于我的数据
- m3db有布隆过滤器来防止这个问题
配置prometheus remote_read prometheus
01 两个prometheus采集器只保留 采集本机node_exporter的job
- 配置如下
global:
  scrape_interval:     15s # Set the scrape interval to every 15 seconds. Default is every 1 minute.
  evaluation_interval: 15s # Evaluate rules every 15 seconds. The default is every 1 minute.
  query_log_file: /opt/logs/prometheus_query_log

scrape_configs:
  - job_name: node_exporter
    honor_timestamps: true
    scrape_interval: 15s
    scrape_timeout: 10s
    static_configs:
    - targets:
- 192.168.0.106:9100- 这样在单一prometheus中只能查询到自己的数据
02 启动一个 p_query的服务 multi_remote_read 多个采集器
- 准备数据目录
mkdir -pv  /opt/app/p_query/
tar xf /opt/tgzs/prometheus-2.29.1.linux-amd64.tar.gz -C /root
/bin/cp -fa /root/prometheus-2.29.1.linux-amd64/* /opt/app/p_query/- 配置如下
cat <<EOF >/opt/app/p_query/p_query.yml
global:
  scrape_interval:     15s # Set the scrape interval to every 15 seconds. Default is every 1 minute.
  evaluation_interval: 15s # Evaluate rules every 15 seconds. The default is every 1 minute.
  query_log_file: /opt/logs/prometheus_query_log

remote_read:
  - url: "http://192.168.3.200:9090/api/v1/read"
    read_recent: true
  - url: "http://192.168.3.201:9090/api/v1/read"
    read_recent: true
EOF- 准备service 文件
cat <<EOF >/etc/systemd/system/p_query.service
[Unit]
Description="p_query"
Documentation=https://p_query.io/
After=network.target

[Service]
Type=simple
ExecStart=/opt/app/p_query/prometheus  --config.file=/opt/app/p_query/p_query.yml  --web.enable-lifecycle --web.listen-address=0.0.0.0:8090

Restart=on-failure
SuccessExitStatus=0
LimitNOFILE=65536
StandardOutput=syslog
StandardError=syslog
SyslogIdentifier=p_query

[Install]
WantedBy=multi-user.target
EOF
systemctl daemon-reload
systemctl restart p_query
03验证 查询效果
- 验证在 p_query服务上,即可查到所有数据

- 验证grafana node_exporter大盘替换数据源 可以查到所有的机器数据
- 先新建一个p_query的数据源 8090,地址是这个multi_remote_read的prometheus的地址
- 导入 node_exporter大盘,注意改名字和id https://grafana.com/grafana/dashboards/8919
- 验证新的大盘上能查到两个机器的数据,对比一个prometheus数据源的大盘


本节重点总结 :
prometheus 低成本存储multi_remote_read方案说明
- 数据重复怎么办
配置prometheus remote_read prometheus