
Prometheus 第34章:M3DB
2026/8/13大约 17 分钟
Prometheus · 第 34 章(合并)
由原课程小节笔记合并,便于连续阅读。
34.1 uber开源的m3db简介
本节重点介绍 :
- m3db自己的定位
- m3db自己的架构
- m3db自己的组件
两句话简介
- M3最初是在优步开发的,目的是提供对优步业务运营,微服务和基础架构的可视性
- 由于M3具有轻松进行水平扩展的能力,因此它为所有监视用例提供了一个集中式存储解决方案。
m3db地址
m3db自己的定位


历史
- 2014年,经过数年与基于Graphite和WhisperDB的传统指标平台的对抗之后,Uber的Observability团队开始开发一个开源指标平台
- 该平台将被称为M3。该项目的目标是为团队提供一个高度可用的集中式指标平台,该平台可以轻松地与现有工具集成。
存储发展过程
- 存储层的第一个迭代以Cassandra和ElasticSearch为特色
- 但是,随着打车业务进入高速增长阶段,在Graphite和WhisperDB年代曾困扰团队的交火重新浮出水面
- 然后,团队决定从头开始构建M3DB,这是一个具有嵌入式反向索引的自定义时间序列数据库,这成为了平台的基础
- 在大约一年半的时间里,M3DB是在Uber上开发和推出的。
查询问题
- OOM和缓慢的查询已成为常见现象,这使团队无法有效地监视其服务
- 名为M3Query的新查询引擎利用了M3DB将数据存储在高度压缩的块中的事实,并在延迟应用函数时一次将数据客户端的一个数据点解压缩
- 这些优化可最大程度地减少网络,计算和内存资源
- 支持PromQL和传统Graphite语言的新查询引擎为团队提供了一种非常快速和强大的方法来深入了解其指标
采集问题
- 随着要摄取的指标数量的激增,很明显,在数据存储策略方面,没有一种万能的方法
- 不同的团队希望将其指标存储在不同的分辨率和保留期限内
- 例如,基础架构团队需要以非常高的分辨率(但时间不能太长)存储度量
- 相反,业务团队不需要精细的粒度,但希望将数据保留更长的时间
- 该解决方案是M3Coordinator和M3Aggregator这两个组件的组合,它们协同工作以获取指标并以高度可定制的方式聚合它们,同时提供高可用性和效率
架构图
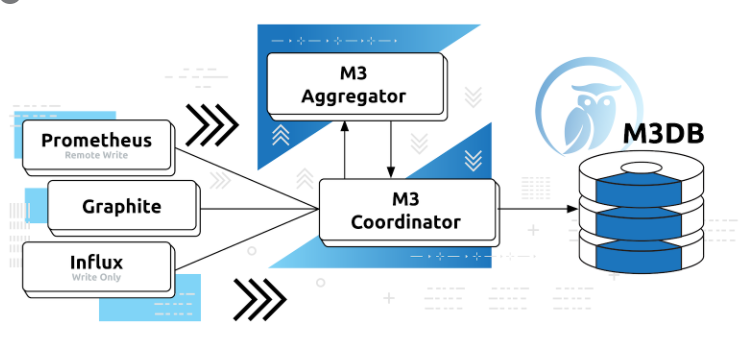
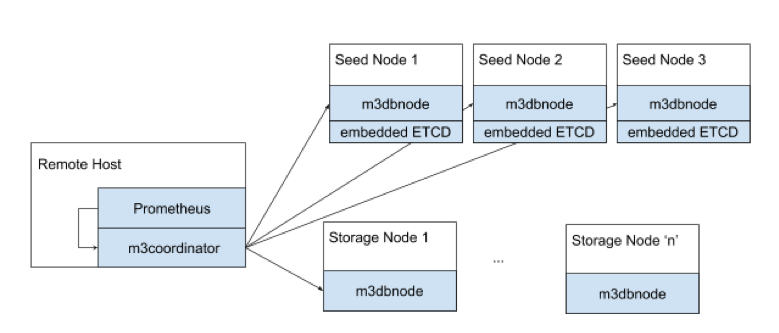
组件说明
M3 Coordinator
- M3协调器是一项服务,用于协调上游系统(例如Prometheus)和M3DB之间的读写
- 它是用户可以部署以访问M3DB好处的桥梁,例如长期存储和与其他监视系统(例如Prometheus)的多DC设置
m3db
- M3DB是一个分布式时间序列数据库,提供可伸缩的存储和时间序列的反向索引
- 它被优化为具有成本效益的,可靠的实时和长期保留指标存储和索引
m3query
- M3 Query是一个分布式查询引擎,用于查询存储在M3DB节点中的实时和历史数据,支持多种查询语言
- 它旨在支持低延迟的实时查询和执行时间可能更长的查询,这些数据可以聚合用于分析用例的较大数据集
- 例如,如果您将Prometheus远程写端点与M3 Coordinator一起使用,则可以使用M3 Query代替Prometheus远程读端点
- 这样,您可以获得M3 Query引擎的所有好处,例如块处理。由于M3 Query提供了与Prometheus兼容的API,因此您可以使用第三方制图和警报解决方案,例如Grafana
m3aggregator
- M3聚合器是专用的度量标准聚合器,可在将度量标准存储在M3DB节点中之前提供基于状态的基于流的下采样。它使用存储在etcd中的动态规则。
- 它使用领导者选举和聚集窗口跟踪,利用etcd来管理此状态,以可靠的方式将一次至少一次的聚集可靠地发送给长期存储的降采样指标。这提供了具有成本效益的,可靠的下采样和指标汇总。
- M3协调器也可以执行此角色,但是M3聚合器可以分片和复制指标,而M3协调器则不是,并且需要谨慎地以高度可用的方式进行部署和运行。
- 与M3DB相似,M3 Aggregator默认情况下支持集群和复制。这意味着度量标准已正确路由到负责聚合每个度量标准的实例,并且您可以配置多个M3 Aggregator副本,以使聚合没有单点故障。
本节重点总结 :
- m3db自己的定位
- m3db自己的架构
- m3db自己的组件
34.2 m3db上手搭建
本节重点介绍 :
- 单机版m3db安装
- 安装
- 和prometheus 通过remote_read整合
- 配置文件解读
单机版安装
下载二进制
wget https://github.com/m3db/m3/releases/download/v1.1.0/m3_1.1.0_linux_amd64.tar.gz准备文件
- 依赖文件
m3dbnodem3dbnode.service``m3dbnode_single.yaml - 执行
m3db_single_install.sh
执行 m3db_single_install.sh
#!/bin/bash
# 下载 包
wget https://github.com/m3db/m3/releases/download/v1.1.0/m3_1.1.0_linux_amd64.tar.gz
# 解压

systemctl stop m3dbnode
# 慎重哦
rm -rf /opt/app/m3db
# 创建目录
mkdir -p /opt/app/m3db/data/{m3db,m3kv}
# 拷贝文件
/bin/cp -f  m3dbnode /opt/app/m3db/m3dbnode
/bin/cp -f  m3dbnode_single.yaml /opt/app/m3db/m3dbnode_single.yaml
# 设置内核参数
sysctl -w vm.max_map_count=3000000
sysctl -w vm.swappiness=1
sysctl -w fs.file-max=3000000
sysctl -w fs.nr_open=3000000
ulimit -n 3000000

grep 'vm.max_map_count = 3000000' /etc/sysctl.conf || cat >> /etc/sysctl.conf <<'EOF'
# m3db
vm.max_map_count = 3000000
vm.swappiness = 1
fs.file-max = 3000000
fs.nr_open = 3000000
EOF

# 复制service文件
sudo /bin/cp -f -a m3dbnode.service /etc/systemd/system/m3dbnode.service
systemctl daemon-reload
systemctl start m3dbnode
systemctl status m3dbnode

# sleep 10 等等服务启动
sleep 10
# 创建namespace和placement
curl -X POST http://localhost:7201/api/v1/database/create -d '{
  "type": "local",
  "namespaceName": "default",
  "retentionTime": "48h",
  "numShards": "8"
}'

# 查看初始化状态
curl http://localhost:7201/api/v1/services/m3db/placement  |python -m json.tool
# ready一下

#!/bin/bash
curl -X POST http://localhost:7201/api/v1/services/m3db/namespace/ready -d '{
  "name": "default"
}'

# 写入测试数据
#!/bin/bash
curl -X POST http://localhost:7201/api/v1/json/write -d '{
  "tags":
    {
      "__name__": "third_avenue",
      "city": "new_york",
      "checkout": "1"
    },
    "timestamp": '\"$(date "+%s")\"',
    "value": 3347.26
}'
# 查询测试数据

curl -X "POST" -G "http://localhost:7201/api/v1/query_range" \
  -d "query=third_avenue" \
  -d "start=$(date "+%s" -d "45 seconds ago")" \
  -d "end=$( date +%s )" \
  -d "step=5s"
集群版安装教程
过程
配置文件讲解
注意事项
- 单机版内嵌了etcd进程,如果测试机上有etcd的需要注意下端口冲突
m3dbnode可以选择是否开启内嵌的m3coordinator
配置文件解读
# 是否开启内嵌的 M3Coordinator
coordinator:
  # Address for M3Coordinator to listen for traffic.
  listenAddress: 0.0.0.0:7201
  # 所有m3db namespace(理解为表)都必须列在这里,
  # 如果少了则读写丢数据
  # All configured M3DB namespaces must be listed in this config if running an
  # embedded M3Coordinator instance.
  local:
    namespaces:
      - namespace: default
        type: unaggregated
        retention: 48h

  # M3Coordinator 日志
  logging:
    level: info

  # M3Coordinator metric
  metrics:
    scope:
      # Prefix to apply to all metrics.
      prefix: "coordinator"
    prometheus:
      # Path and address to expose Prometheus scrape endpoint.
      handlerPath: /metrics
      listenAddress: 0.0.0.0:7203 # until https://github.com/m3db/m3/issues/682 is resolved
    sanitization: prometheus
    # Sampling rate for metrics, use 1.0 for no sampling.
    samplingRate: 1.0
    extended: none

  tagOptions:
    # Configuration setting for generating metric IDs from tags.
    idScheme: quoted

db:
  # Minimum log level which will be emitted.
  logging:
    level: info

  # Configuration for emitting M3DB metrics.
  metrics:
    prometheus:
      # Path to expose Prometheus scrape endpoint.
      handlerPath: /metrics
    sanitization: prometheus
    # Sampling rate for metrics, use 1.0 for no sampling.
    samplingRate: 1.0
    extended: detailed

  # 9000 是本实例的 thrift/tchannel接收数据接口
  # Address to listen on for local thrift/tchannel APIs.
  listenAddress: 0.0.0.0:9000
  # 9001 是集群间实例的 thrift/tchannel接收数据接口
  # Address to listen on for cluster thrift/tchannel APIs.
  clusterListenAddress: 0.0.0.0:9001
  # 9002 是本实例的json/http接口 (主要用来debug)
  # Address to listen on for local json/http APIs (used for debugging primarily).
  httpNodeListenAddress: 0.0.0.0:9002
  # Address to listen on for cluster json/http APIs (used for debugging primarily).
  httpClusterListenAddress: 0.0.0.0:9003
  # Address to listen on for debug APIs (pprof, etc).
  debugListenAddress: 0.0.0.0:9004

  # Configuration for resolving the instances host ID.
  hostID:
    # "Config" resolver states that the host ID will be resolved from this file.
    resolver: config
    value: m3db_local

  client:
    # Consistency level for writes.
    writeConsistencyLevel: majority
    # Consistency level for reads.
    readConsistencyLevel: unstrict_majority
    # Timeout for writes.
    writeTimeout: 10s
    # Timeout for reads.
    fetchTimeout: 15s
    # Timeout for establishing a connection to the cluster.
    connectTimeout: 20s
    # Configuration for retrying writes.
    writeRetry:
        initialBackoff: 500ms
        backoffFactor: 3
        maxRetries: 2
        jitter: true
    # Configuration for retrying reads.
    fetchRetry:
        initialBackoff: 500ms
        backoffFactor: 2
        maxRetries: 3
        jitter: true
    # Number of times we background health check for a node can fail before
    # considering the node unhealthy.
    backgroundHealthCheckFailLimit: 4
    backgroundHealthCheckFailThrottleFactor: 0.5

  # Sets GOGC value.
  gcPercentage: 100

  # Whether new series should be created asynchronously (recommended value
  # of true for high throughput.)
  writeNewSeriesAsync: true
  writeNewSeriesBackoffDuration: 2ms

  bootstrap:
    commitlog:
      # Whether tail end of corrupted commit logs cause an error on bootstrap.
      returnUnfulfilledForCorruptCommitLogFiles: false

  cache:
    # Caching policy for database blocks.
    series:
      policy: lru

  commitlog:
    # Maximum number of bytes that will be buffered before flushing the commitlog.
    flushMaxBytes: 524288
    # Maximum amount of time data can remain buffered before flushing the commitlog.
    flushEvery: 1s
    # Configuration for the commitlog queue. High throughput setups may require higher
    # values. Higher values will use more memory.
    queue:
      calculationType: fixed
      size: 2097152

  filesystem:
    # Directory to store M3DB data in.
    filePathPrefix: /opt/app/m3db/data
    # Various fixed-sized buffers used for M3DB I/O.
    writeBufferSize: 65536
    dataReadBufferSize: 65536
    infoReadBufferSize: 128
    seekReadBufferSize: 4096
    # Maximum Mib/s that can be written to disk by background operations like flushing
    # and snapshotting to prevent them from interfering with the commitlog. Increasing
    # this value can make node adds significantly faster if the underlyign disk can
    # support the throughput.
    throughputLimitMbps: 1000.0
    throughputCheckEvery: 128

  # This feature is currently not working, do not enable.
  repair:
    enabled: false
    throttle: 2m
    checkInterval: 1m

  # etcd configuration.
  discovery:
    config:
        service:
            # KV environment, zone, and service from which to write/read KV data (placement
            # and configuration). Leave these as the default values unless you know what
            # you're doing.
            env: default_env
            zone: embedded
            service: m3db
            # Directory to store cached etcd data in.
            cacheDir: /opt/app/m3db/m3kv
            # Configuration to identify the etcd hosts this node should connect to.
            etcdClusters:
                - zone: embedded
                  endpoints:
                      - 127.0.0.1:2379
        # Should only be present if running an M3DB cluster with embedded etcd.
        seedNodes:
            initialCluster:
                - hostID: m3db_local
                  endpoint: http://127.0.0.1:2380
和prometheus整合
# 在prometheus.yml 添加remote_read/write 段即可
remote_write:
  - url: "http://192.168.3.201:7201/api/v1/prom/remote/write"
remote_read:
  - url: "http://192.168.3.201:7201/api/v1/prom/remote/read"
    read_recent: true

# 在m3dnode上抓包查看
tcpdump -i any tcp dst port 9000 -nn -vv -p -A
找一个prometheus只做query remote_read m3coor
remote_read:
  - url: "http://192.168.0.107:7201/api/v1/prom/remote/read"
    read_recent: true
测试查询数据
- 截图
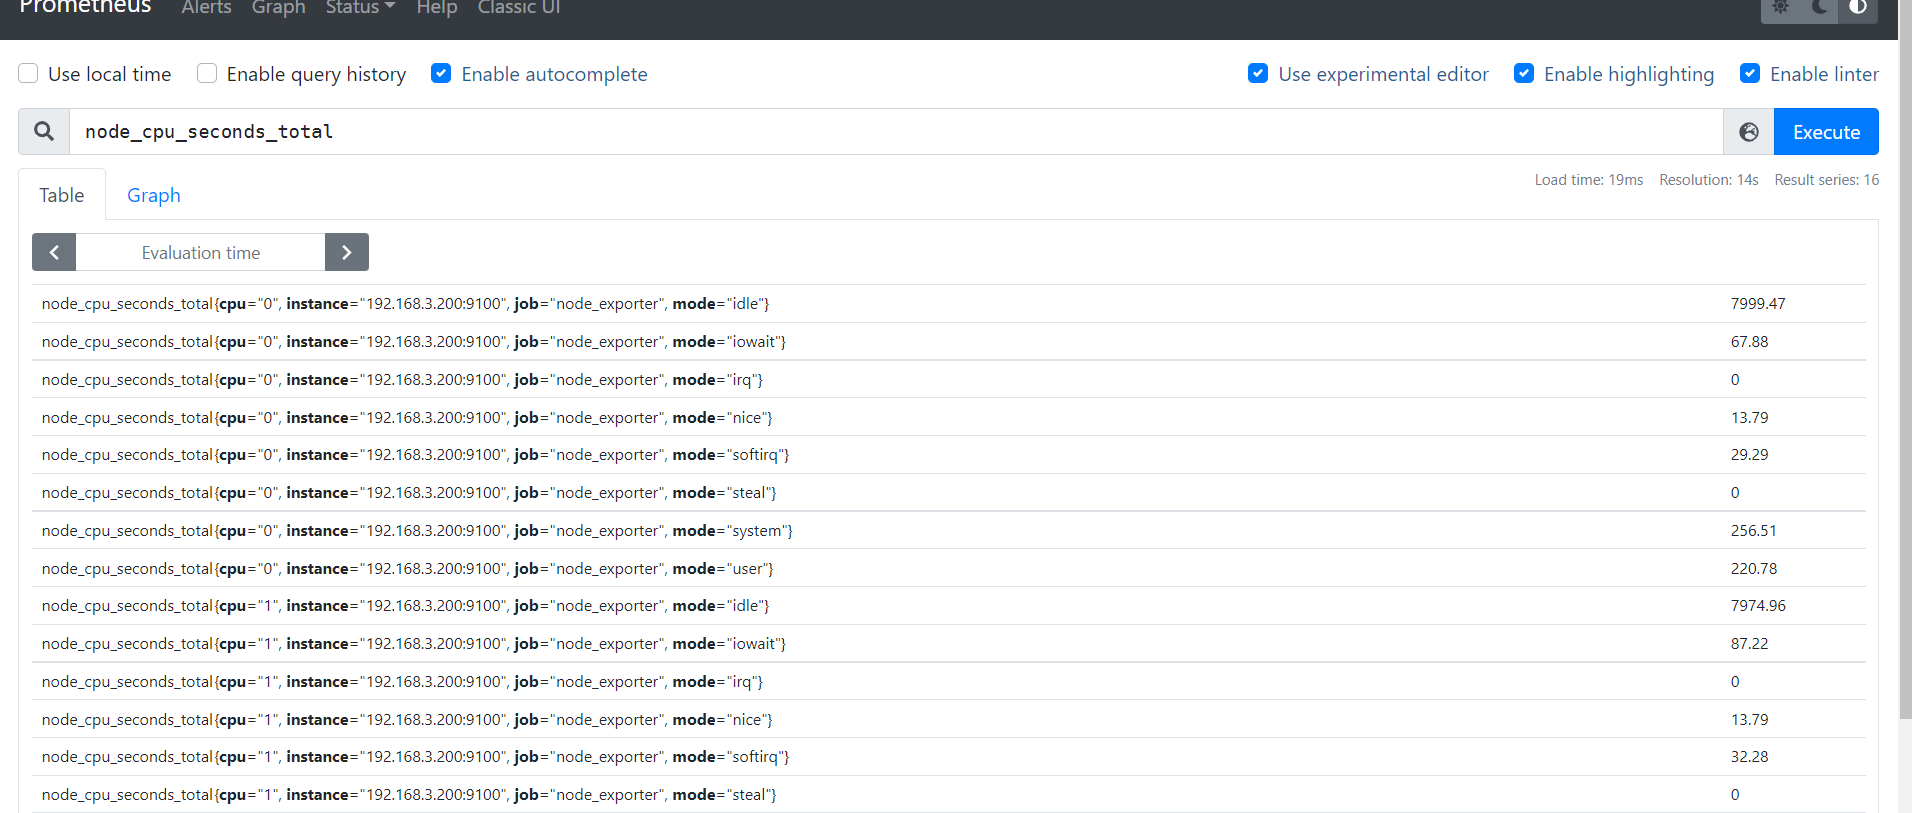
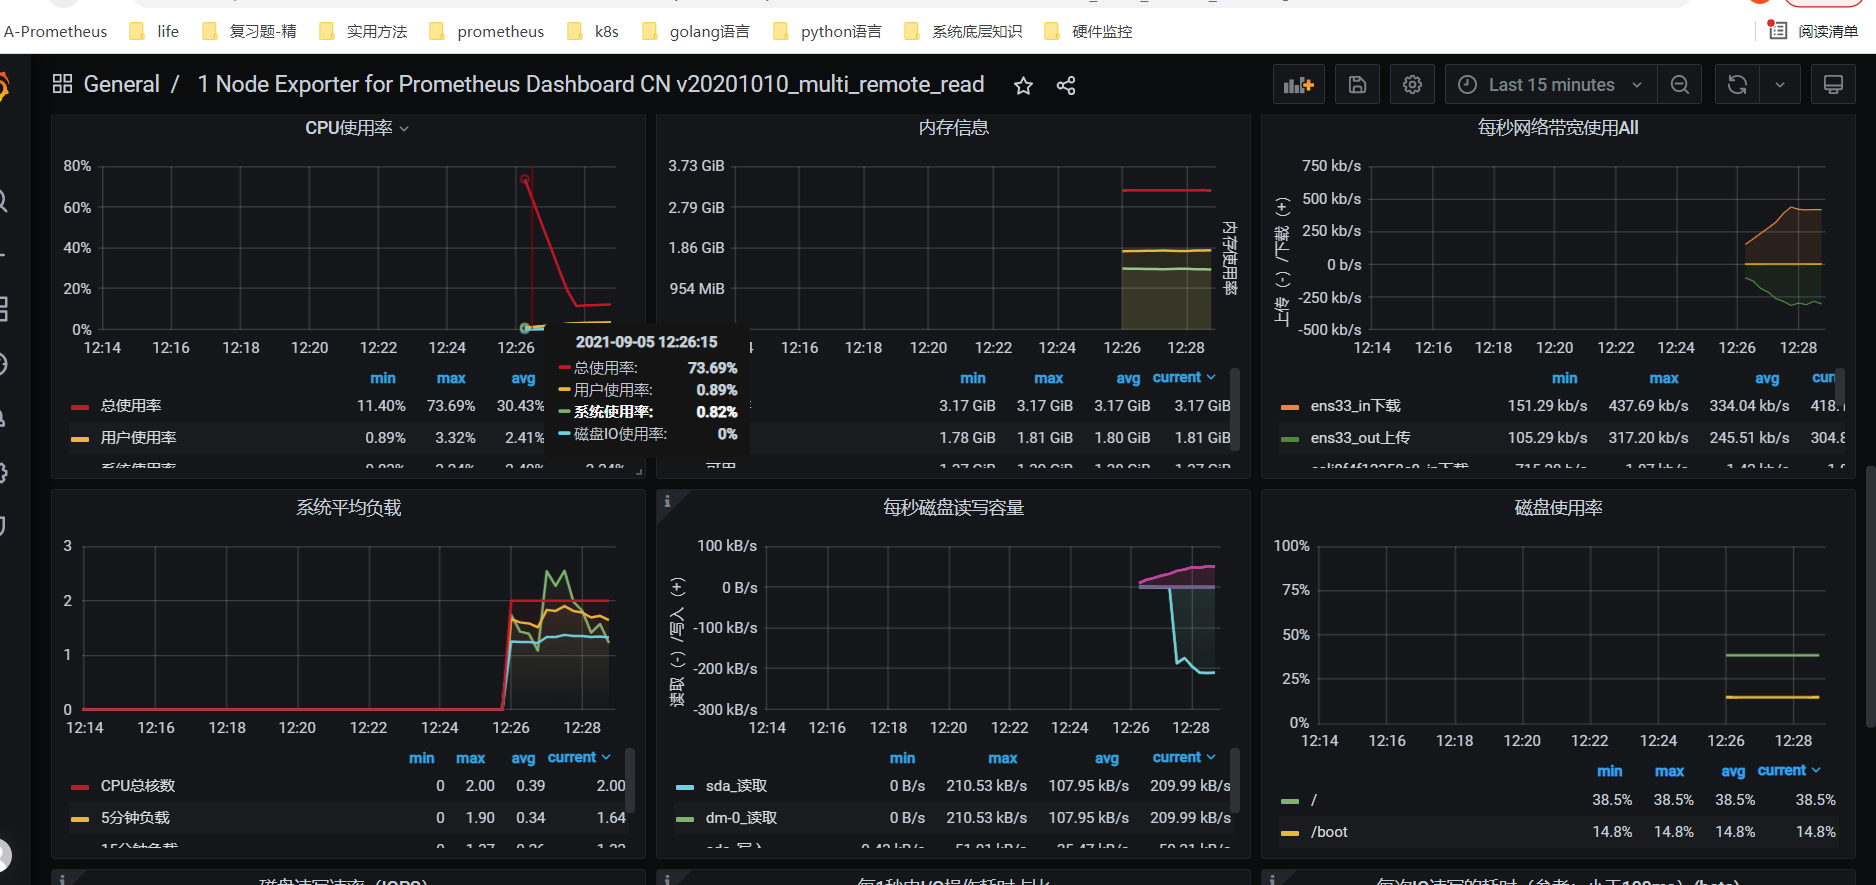
本节重点总结 :
- 单机版m3db安装
- 安装
- 和prometheus 通过remote_read整合
- 配置文件解读
34.3 m3db-oom的内存火焰图和内存分配器加油模型源码解读
本节重点介绍 :
- m3dbnode oom时内存火焰图追查源码调用
- 内存分配器加油模型源码解读
- 高基数查询导致m3db oom
m3dbnode oom
oom时排查监控曲线
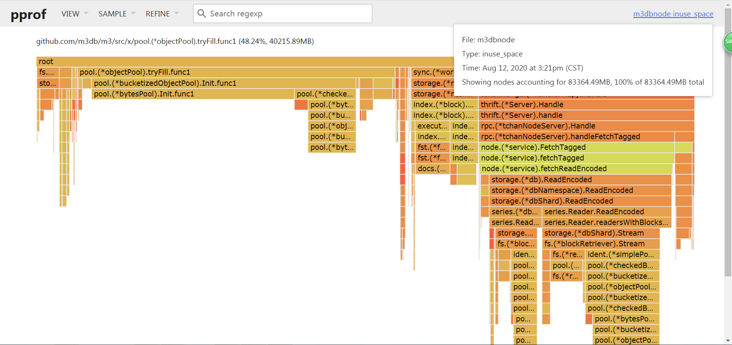
- 内存火焰图: 80G内存
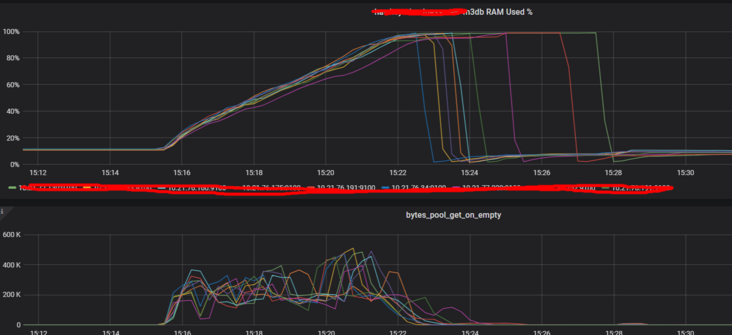
- bytes_pool_get_on_empty qps 很高
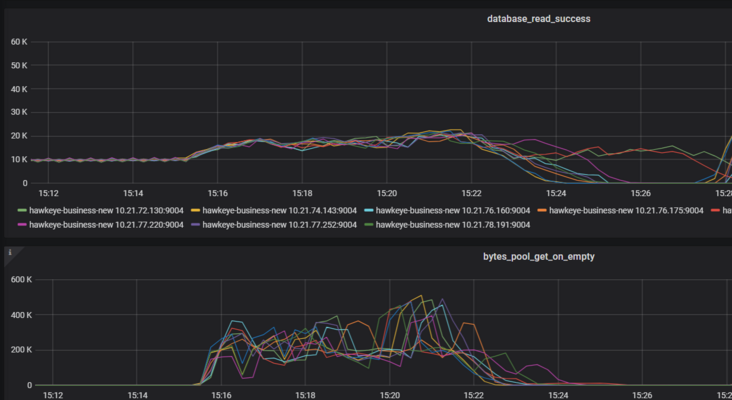
- db read qps增长 80%
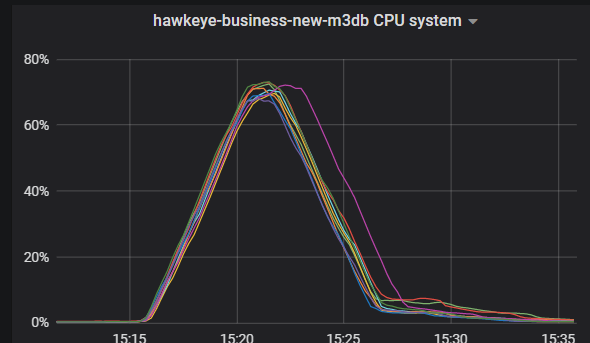
- node cpu kernel 暴涨
看图结论
- m3dbnode 内存oom过程很短,很剧烈:总时间不超过7分钟
- 内存从27G增长到250G
- 节点sys态cpu暴涨:因为大量的mem_alloca sys_call
- 内存增长曲线和db_read_qps曲线和bytes_pool_get_on_empty曲线高度吻合
- 内存火焰图: 27G的rpc 40G的pool.(*objectPool).tryFill
查看代码,追踪火焰图中这个tryFill
内存分配器
- 目的很简单:自己管理内存
- 避免频繁的mem_allocate
- sys_call提升速度,空间换时间
核心结构 objectPool
- 位置 D:\go_path\pkg\mod\github.com\m3db\m3@v1.1.0\src\x\pool\object.go
type objectPool struct {
	opts                ObjectPoolOptions
	values              chan interface{}
	alloc               Allocator
	size                int
	refillLowWatermark  int
	refillHighWatermark int
	filling             int32
	initialized         int32
	dice                int32
	metrics             objectPoolMetrics
}- 初始化时调用Init 向池中注入
func (p *objectPool) Init(alloc Allocator) {
	if !atomic.CompareAndSwapInt32(&p.initialized, 0, 1) {
		p.onPoolAccessErrorFn(errPoolAlreadyInitialized)
		return
	}

	p.values = make(chan interface{}, p.size)
	for i := 0; i < cap(p.values); i++ {
		p.values <- alloc()
	}

	p.alloc = alloc
	p.setGauges()
}
从池中获取对象时
- 池中还有剩余则直接获取
- 否则走各自的alloc分配,同时设置这个 bytes_pool_get_on_empty指标+1
func (p *objectPool) Get() interface{} {
	var (
		metrics = p.metrics
		v       interface{}
	)

	select {
	case v = <-p.values:
	default:
		v = p.alloc()
		metrics.getOnEmpty.Inc(1)
	}

	if unsafe.Fastrandn(sampleObjectPoolLengthEvery) == 0 {
		// inlined setGauges()
		metrics.free.Update(float64(len(p.values)))
		metrics.total.Update(float64(p.size))
	}

	if p.refillLowWatermark > 0 && len(p.values) <= p.refillLowWatermark {
		p.tryFill()
	}

	return v
}
每次Get同时判断池水位,是否加油
	if p.refillLowWatermark > 0 && len(p.values) <= p.refillLowWatermark {
		p.tryFill()
	}
加油过程
- 用CompareAndSwapInt32做并发控制标志位
- 加油加到refillHighWatermark
func (p *objectPool) tryFill() {
	if !atomic.CompareAndSwapInt32(&p.filling, 0, 1) {
		return
	}

	go func() {
		defer atomic.StoreInt32(&p.filling, 0)

		for len(p.values) < p.refillHighWatermark {
			select {
			case p.values <- p.alloc():
			default:
				return
			}
		}
	}()
}
默认池参数
	defaultRefillLowWaterMark  = 0.3
	defaultRefillHighWaterMark = 0.6
总结思考
- 默认池低水位为什么不是0:因为 从水位判断到tryFill中间的并发请求使得最后tryFill开始时低水位可能低于0.3
- 火焰图中的tryFill消耗了40G内存不是一次性的,类比右侧thriftrpc27,属于累加内存消耗值
- 一次性的内存消耗肯定没有这么多:每次加油时内存消耗低于初始化
- 所以可以得到结论,oom是因为在当时byte_pool频繁的get消耗,然后tryFill频繁的加油导致内存分配
- 所以根本原因还是查询导致的
临时解决办法:限制query资源消耗保护db
- 首先要明确的几点,因为remote_read是链式的调用
- 所以限制m3db前面的组件
prometheusm3coordinator是没用的 - 只能限制m3db中关于query的参数,但是这个方法不根治
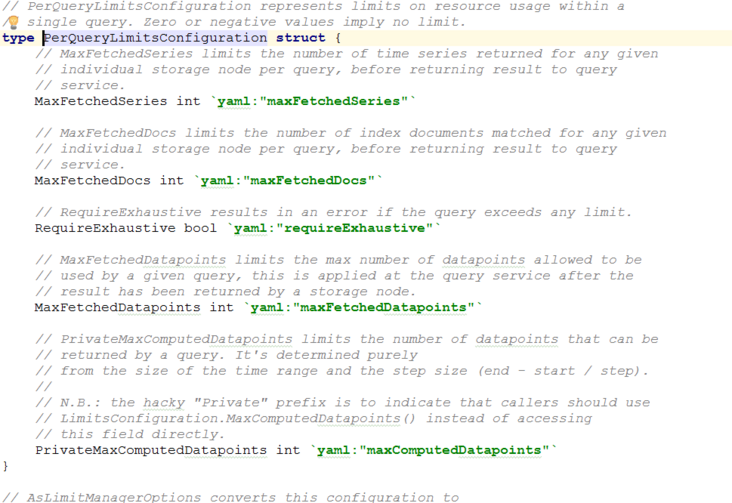
上面的方法治标不治本,重要的是解决高基数/重查询的问题
本节重点总结 :
- m3dbnode oom时内存火焰图追查源码调用
- 内存分配器加油模型源码解读
- 高基数查询导致m3db oom
34.4 m3db调优踩坑问题总结
本节重点介绍 :
- m3db资源开销
- 无需ssd
- 读写峰对cpu和内存的开销
- 聚合选择
- 不要直接在m3coordinator 中开启聚合
- 利用m3aggregator 做downsample
- m3db 读写一致性
- m3db运维操作
m3db资源开销问题:无需用ssd,也没必要做raid
正常情况下m3db 对io要求不高
- 因为和prometheus一样设计时采用了
mmap等技术,所以没必要采用ssd - 和open-falcon/夜莺等采用rrd不同,rrd 单指标单文件,很耗io
cpu和内存开销
写峰很危险,原因很简单
- 一条新的数据写入的时候,需要申请block,索引等一系列内存,伴随着cpu开销
- 但是如果没有新的数据,只是不断的写入点,那么只涉及到点的append追加,则开销较小
- 所以在突发的写峰对于tsdb来说就是危险,比如auto_scaling
- 最理想的情况就是100w条数据,都是平稳的没有变化的持续追加点写入
- 但是在容器中不现实,因为每次pod滚动都涉及 id等唯一值的变化
读峰也很危险,原因如下
- m3db默认内置lru会缓存查询的block等,这个为了一个典型的场景
- 就是一个dashboard查出来后点刷新时间,除了时间其他查询tag没变化,这种lru能应付的很好
- 但是对于高基数的查询来说,lru的意义就不大了
- 而且会涉及到读取放大的问题,假设1w基数需要100M内存,则100w基数需要10G内存
m3db bootstrap速度问题
- 在节点oom或其他原因导致的重启中,bootstrap速度决定了节点多久能提供服务
- bootstrap速度和
namespace 数量正相关,和数据量大小正相关 - 而且会优先提供写服务,避免长时间不能写入数据造成断点
- 而且再重启时 会有大量读盘操作,基本能把io打满(因为需要将磁盘中的部分数据缓存到内存中)
聚合说明
不要直接在m3coordinator 中开启聚合
- 我们知道直接在m3coordinator中配置
type: aggregated的namespace是可以直接开启聚合的 - 但是官方文档 说的很清楚了
The M3 Coordinator also performs this role but is not cluster aware.
This means metrics will not get aggregated properly if you send metrics in round robin fashion to multiple M3 Coordinators for the same metrics ingestion source (e.g. Prometheus server).- 因为数据按照轮询模式打过来到m3coordinator上,导致同一个指标的不同时刻数据可能出现在多个m3coordinator上,聚合出来的结果就是错的
利用m3aggregator 做downsample
- 与M3DB相似m3aggregator,默认情况下支持集群和复制。
- 这意味着度量标准已正确路由到负责聚合每个度量标准的一个或多个实例
- 并且m3aggregator可以配置多个副本,以使聚合没有单点故障。
降采样原理
m3agg根据配置的resolution计算后推给m3coordinator回写m3db- 如下配置我们可以降采样的保存监控数据:注意 下面间隔和粒度都是根据grafana查询时间算的step推算出的
default表:不聚合保存30小时agg1表:5m为粒度保存96小时,即4天agg2表:20m为粒度保存360小时,即15天agg3表:60m为粒度保存2160小时,即3个月
      - namespace: default
        type: unaggregated
        retention: 30h
      - namespace: agg1
        type: aggregated
        retention: 96h
        resolution: 5m
      - namespace: agg2
        type: aggregated
        retention: 360h
        resolution: 20m
      - namespace: agg3
        type: aggregated
        retention: 2160h
        resolution: 60m
降采样后多张表数据 merge
- 数据在每张表中都会存在
- 依据不同的保存精度,agg会聚合写入结果
- 多张表查询的时候,每个时间段以最精确的为准,也就是说会
merge - 如果在查询端少配置了几张表,那么就是缺数据
利用聚合打到降采样的目的
- 减少存储需求
- 对于时间久的数据,以原始点存放其实意义很小,因为查询的时候都会以较粗的精度出图,比如 15天范围内可能就是1个小时一个点了
对于query的limit限制 ,这些限制都治标不治本,因为要看限制在多深的地方设置的
- 举个例子:查询需要5次内存申请,只有在第4层才能判定这个query是否打到上限,那么只是省了最后一次内存申请
- 这样就演变成了:每次都在很深的地方才限制住了,资源总是在浪费
- 如果能在第一层就限制住,如布隆过滤器直接告诉不存在,那么则可以避免后面几次资源开销
m3db limit
- 可以设置在一个回溯窗口内
lookback最大读取的时间序列数据的总量maxRecentlyQueriedSeriesBlocks - 这个配置代表在3秒内最多允许 21w的block查询(7w来自于m3db监控图中的block数据)
- maxOutstandingReadRequests 代表并发读请求数
- maxRecentlyQueriedSeriesDiskRead可以设置读盘的限制
db:
  limits:
    maxRecentlyQueriedSeriesBlocks:
      value: 700000
      lookback: 3s
    maxOutstandingWriteRequests: 0
    maxOutstandingReadRequests: 0
保护m3db的正确姿势,是在前面prometheus查询的时候 识别并拦截高基数查询
常见的运维操作
m3db 读写一致性
- 在db高负载情况下,可以配置m3coordinator 读一致性为one 即
readConsistencyLevel: one,降低后端压力
clusters:
# Fill-out the following and un-comment before using, and
# make sure indent by two spaces is applied.
  - namespaces:
      - namespace: default
        type: unaggregated
        retention: 30h
    client:
      config:
        service:
          env: default_env
          zone: embedded
          service: m3db
          cacheDir: /var/lib/m3kv
          etcdClusters:
            - zone: embedded
              endpoints:
                - xxx1:2379
                - xxx2:2379
                - xxx3:2379
      writeConsistencyLevel: majority
      readConsistencyLevel: one
etcd操作
# 执行etcd host变量
ETCDCTL_API=3
HOST_1=xxx
HOST_2=xxx
HOST_3=xxx
ENDPOINTS=$HOST_1:2379,$HOST_2:2379,$HOST_3:2379

# 获取匹配字符串的key
etcdctl --endpoints=$ENDPOINTS get  --prefix  "" --keys-only=true
_kv/default_env/m3db.node.namespaces
_sd.placement/default_env/m3db

# 删除agg的placement
etcdctl --endpoints=$ENDPOINTS del    /placement/namespace/m3db-cluster-name/m3aggregator

## 删除namespace
etcdctl --endpoints=$ENDPOINTS del _kv/default_env/m3db.node.namespaces
etcdctl --endpoints=$ENDPOINTS del _sd.placement/default_env/m3db
m3db dump火焰图
- 注意在高负载情况下dump的速度会很慢
第一步:请求m3db:7201/debug/dump接口,m3db代码中内置好了生成pprof信息的zip接口
#!/usr/bin/env bash
input_host_file=$1
output_dir=$2
for i in `cat $1`;do
    curl -s $i:7201/debug/dump >${output_dir}/${i}_`date "+%Y_%m_%d_%H_%M_%S"`.zip &
done
第二步:解压zip文件,查看goroutine 执行情况
- 解压zip文件,可以得到cpu、heap、goroutine三个prof文件 和m3db的一些元信息
root@k8s-local-test-02:~/pprof$ ll
total 4060
-rw-r--r-- 1 root root    3473 Dec 31  1979 cpu.prof
-rw-r--r-- 1 root root 3953973 Dec 31  1979 goroutine.prof
-rw-r--r-- 1 root root  178938 Dec 31  1979 heap.prof
-rw-r--r-- 1 root root      40 Dec 31  1979 host.json
-rw-r--r-- 1 root root     592 Dec 31  1979 namespace.json
-rw-r--r-- 1 root root    5523 Dec 31  1979 placement-m3db.json
grep goroutine goroutine.prof | awk -F '[' '/goroutine \d*/{print "[" $2}' |sort | uniq -c | sort -k1nr | head -20
# 可以看到哪些goroutine最多
# 再根据详细的信息分析程序问题
16800 [select]:
9422 [chan receive, 40355 minutes]:
1911 [select, 2 minutes]:
631 [runnable]:
509 [IO wait]:
90 [chan receive, 40341 minutes]:
76 [chan receive]:
72 [semacquire]:
25 [select, 291 minutes]:
23 [sleep]:
17 [chan receive, 7205 minutes]:
17 [chan receive, 7402 minutes]:
14 [select, 4 minutes]:
12 [chan receive, 6120 minutes]:
10 [chan receive, 5577 minutes]:
5 [select, 165 minutes]:
4 [chan receive, 5176 minutes]:
4 [select, 40355 minutes]:
3 [chan receive, 7404 minutes]:
2 [IO wait, 40355 minutes]:第三步: 利用火焰图分析工具分析程序内存和cpu性能
- 安装 graphviz工具
yum -y install graphviz- 根据prof文件生成svg图片,用浏览器打开svg图片即可查看
go tool pprof -svg cpu.prof > cpu.svg- 根据prof文件构建http访问查看
go tool pprof -http=localhost:8088 cpu.prof- 火焰图样例
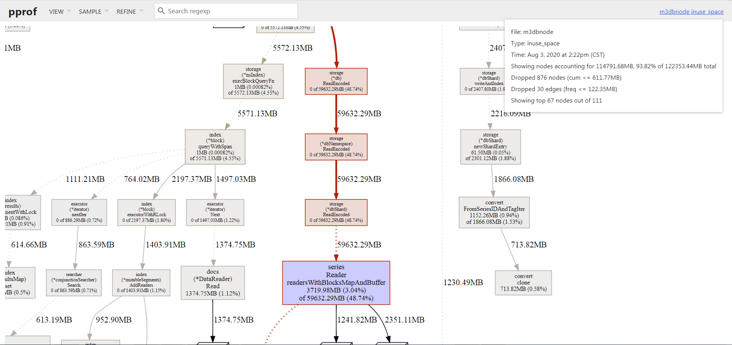
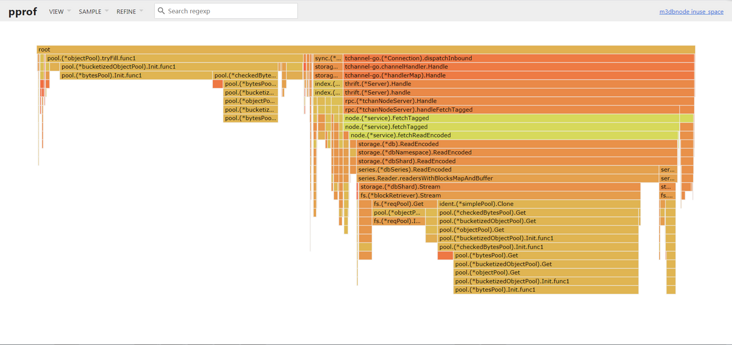
本节重点总结 :
- m3db资源开销
- 无需ssd
- 读写峰对cpu和内存的开销
- 聚合选择
- 不要直接在m3coordinator 中开启聚合
- 利用m3aggregator 做downsample
- m3db 读写一致性
- m3db运维操作